
 Shows Recovery Signs Despite 68% Decline From Peak")
Key Highlights
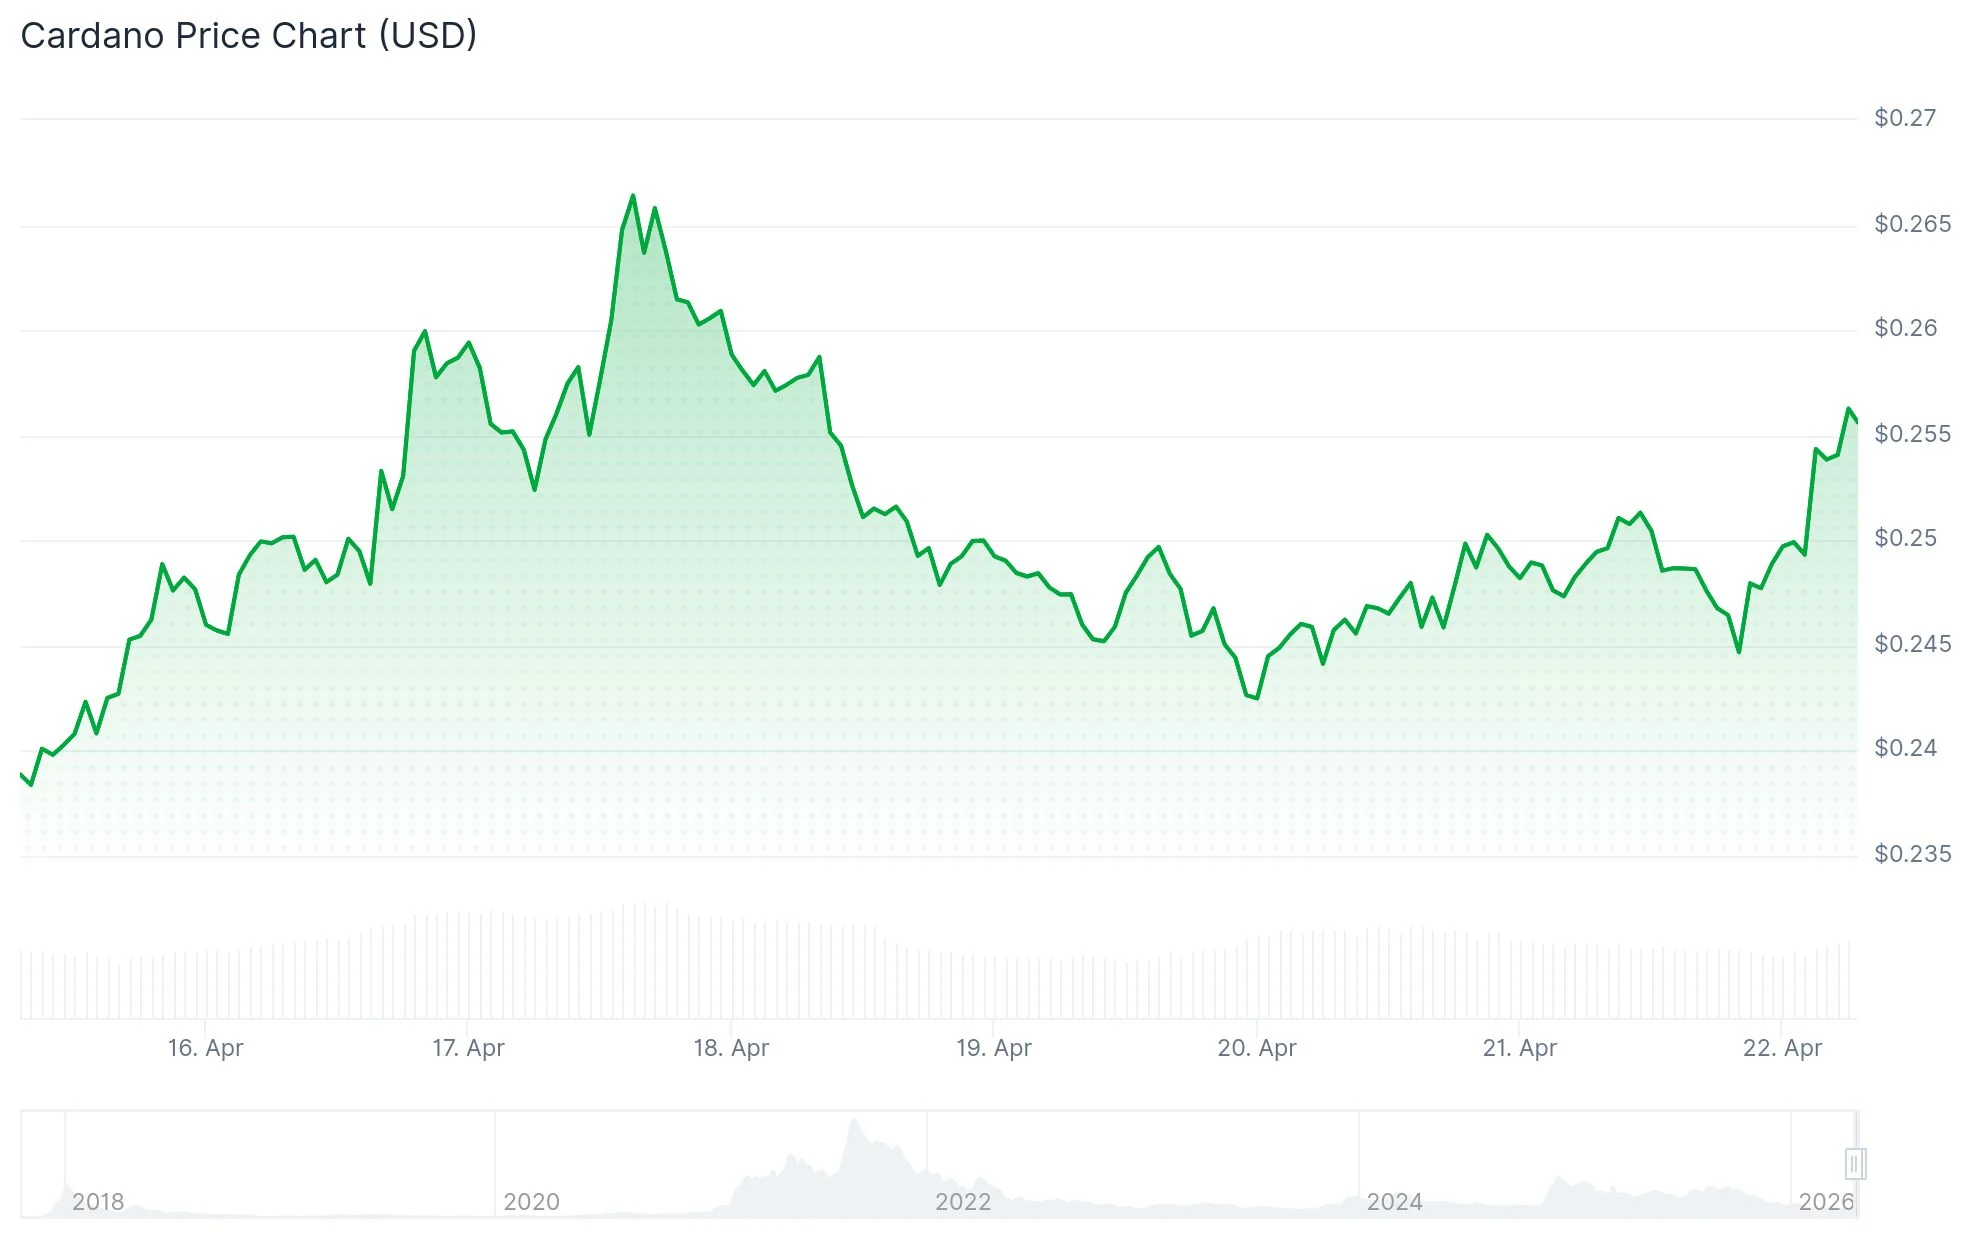
- ADA maintains support near $0.25 with modest gains recorded on April 21
- CME futures contract volumes jumped 155% over two sessions, rising from 27 to 69 contracts
- Open Interest in ADA futures climbed more than 5% within 24 hours, reaching $459.02 million
- Technical chart analysis reveals a falling wedge breakout formation targeting $0.30
- Current long/short ratio of 0.73 indicates potential for short squeeze scenario
Cardano (ADA) has experienced significant downward pressure since mid-January, plummeting 68% from its January 14 peak of $0.42 to current levels around $0.25. Despite this steep decline, fresh signals indicate the altcoin may be preparing for a reversal as market dynamics evolve.
The cryptocurrency market’s fear and greed index has climbed from 12 to 33 during the past seven days. Although sentiment remains within “fear” boundaries, this notable improvement indicates diminishing sell-side pressure across the sector.
Open Interest for ADA futures tracked by CoinGlass surged beyond 5% in a 24-hour period, hitting $459.02 million. The positive funding rate standing at 0.0090% demonstrates that market participants are prepared to pay additional costs to maintain bullish positions.

According to CME Group statistics, ADA futures contract volumes skyrocketed from 27 contracts on April 15 to 69 contracts by April 17. This represents a dramatic 155% increase within merely two trading sessions, signaling heightened institutional participation.
The present long/short ratio stands at 0.73. Given that short sellers currently outnumber long position holders, any unexpected upward price movement could catalyze forced liquidations and accelerated buying pressure.

Funding rates have periodically shifted into negative territory, indicating that market participants are incurring costs to maintain bearish positions. This configuration creates ideal conditions for a potential short squeeze if prices ascend rapidly.
Chart Analysis and Technical Indicators
From a technical standpoint, ADA has successfully breached a falling wedge formation. The cryptocurrency requires multiple successive closes above the pattern’s upper boundary to validate a complete trend reversal.
Measuring the wedge’s height suggests a potential rally from $0.25 to $0.30, representing approximately 23% upside. Technical analysts emphasize that $0.28 must be decisively cleared before $0.30 becomes a viable objective.
The 50-day exponential moving average positioned at $0.26 currently serves as the primary resistance barrier. The 100-day EMA rests at $0.3009 while the 200-day EMA stands at $0.3953, both functioning as significant overhead obstacles.
The Relative Strength Index currently hovers near 51, indicating stabilizing momentum without demonstrating robust strength. Market participants appear cautious at present resistance zones.
The MACD histogram sits marginally above its signal line, maintaining a slightly positive configuration. This development suggests potential for bullish trend development, though definitive confirmation remains absent.
Critical Support Zones
Regarding downside protection, ADA maintains crucial support at $0.2328, corresponding to the March 29 bottom. Should that level fail, $0.2205—marking the February 6 low—would serve as the subsequent defensive threshold.
As of April 21, ADA was changing hands at approximately $0.2554, sustaining position above the $0.25 benchmark for three straight days. The 50-day EMA at $0.26 continues to represent the immediate challenge for sustained upward momentum.
Get 3 Free Stock Ebooks
Discover top-performing stocks in AI, Crypto, and Technology with expert analysis.
- Top 10 AI Stocks - Leading AI companies
- Top 10 Crypto Stocks - Blockchain leaders
- Top 10 Tech Stocks - Tech giants


