
 Hits $1 Trillion Milestone as Price Tests Critical $84 Resistance Zone")
Key Highlights
- SOL confronts critical resistance between $84 and $87, while maintaining crucial support in the $78–$82 range
- Technical analysts identify a weekly broadening pattern suggesting potential cycle peak above $1,000 if validated
- The network achieved a historic milestone with $1.1 trillion in economic activity during Q1 2026—its first trillion-dollar quarter
- Daily active addresses surged to 5.5–5.8 million, significantly exceeding the 3–4 million levels observed in late 2025
- Transfer volumes jumped to $75 billion even as SOL’s price performance remains subdued
Solana finds itself at a pivotal technical juncture. The 1-hour chart reveals SOL pressing against a resistance zone around the mid-$84 level following a rebound from the $78–$81 support range.
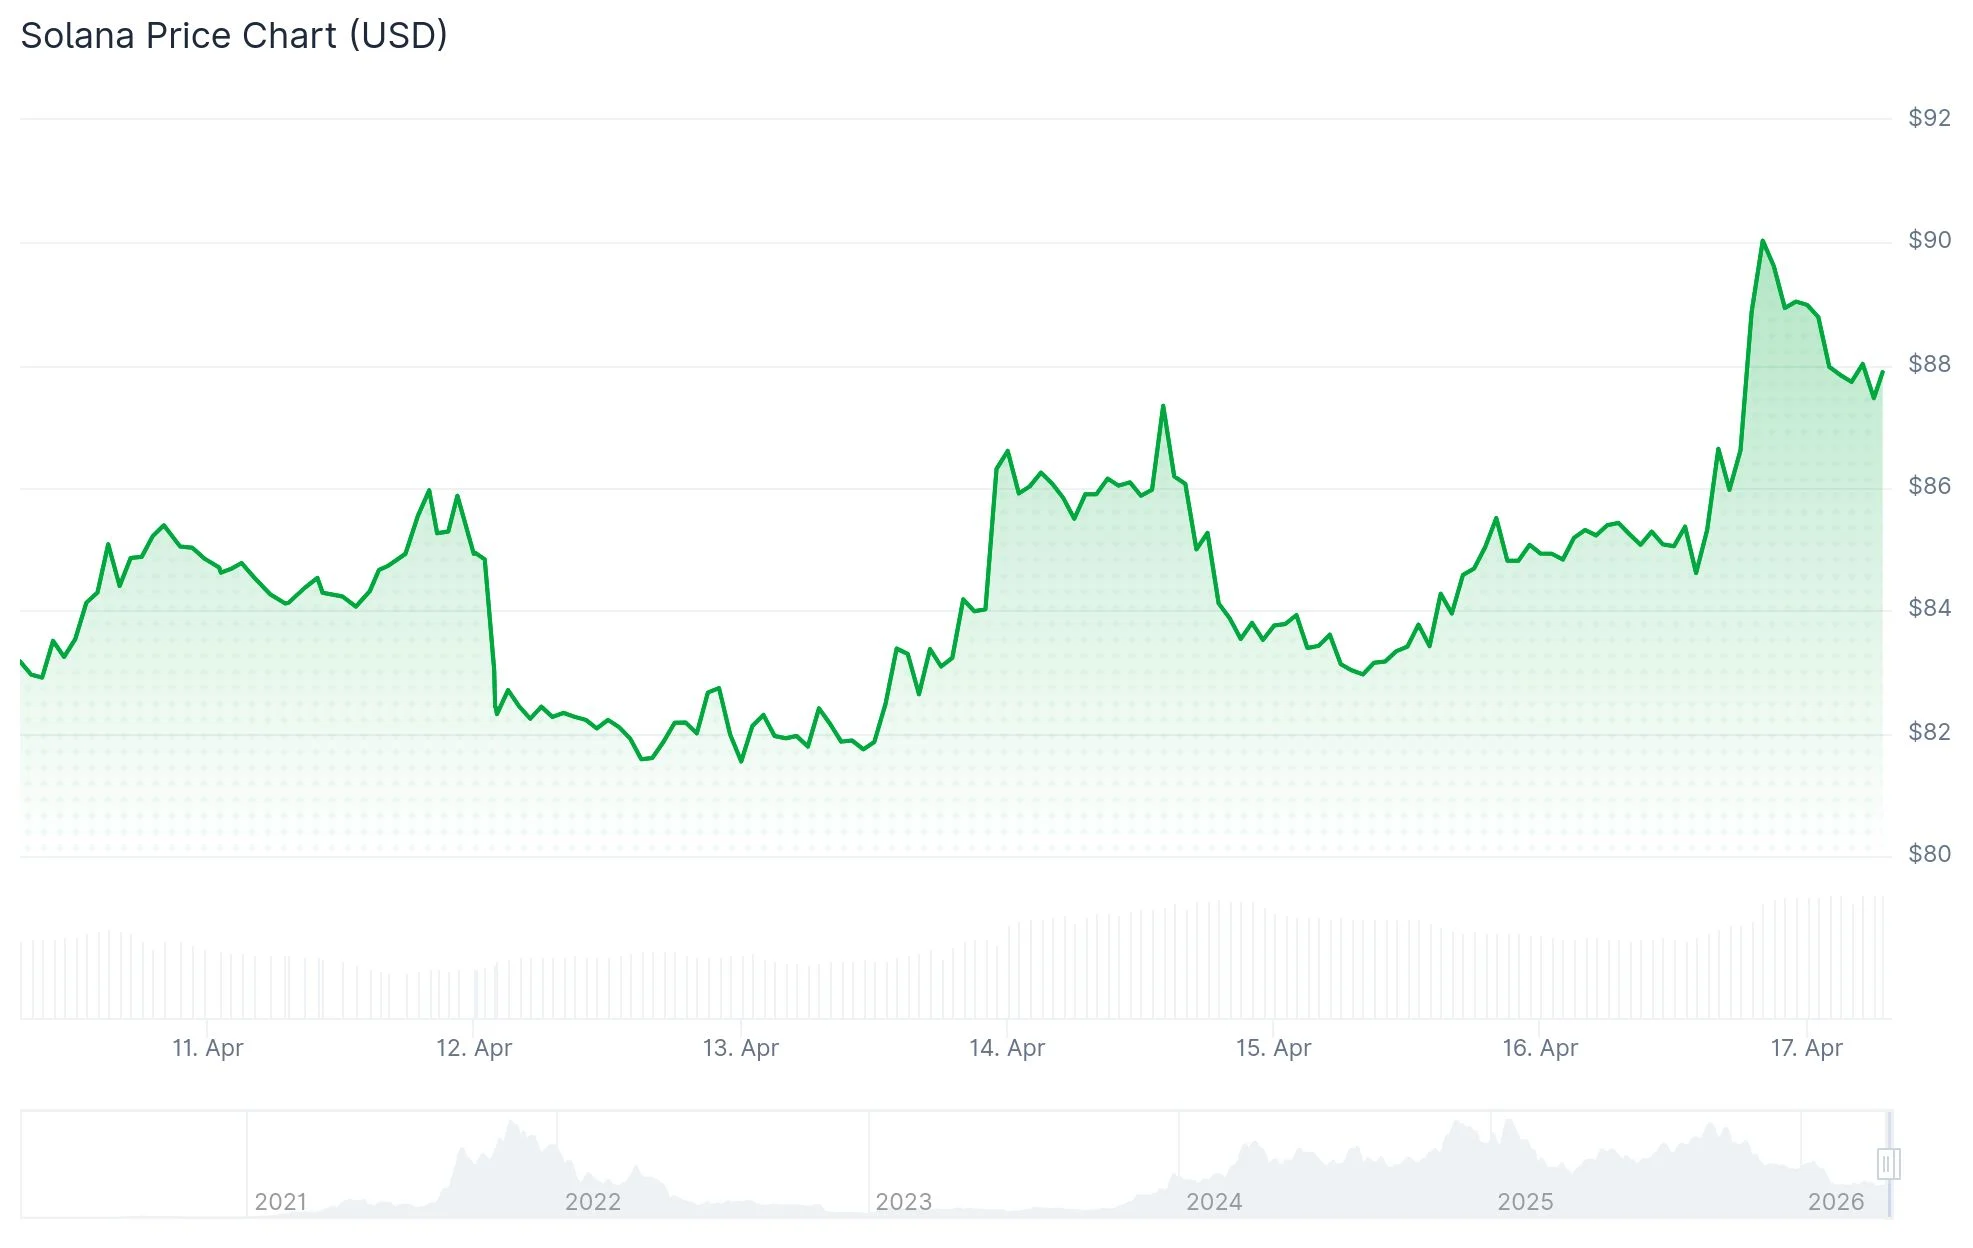
Multiple Fibonacci retracement levels converge tightly in this area—specifically at $84.46, $85.06, $85.56, $86.51, and $87.03. This concentration forms a formidable supply barrier that could prove challenging to penetrate in one attempt.
Should SOL fail to overcome this resistance cluster, a pullback toward the $81.65–$78 support zone becomes likely. Conversely, a decisive breach above resistance would unlock upside potential toward the $87–$88 range.
Analyzing the weekly timeframe, crypto analyst CryptoCurb has identified a broadening megaphone formation on X. This technical structure displays multiple contact points at both the upper trendline resistance and lower support boundary throughout several price cycles.
The pattern’s lower boundary continues to function as reliable support. Maintaining this level keeps the bullish framework valid. CryptoCurb’s upside projection following a confirmed breakout extends beyond $1,000—though this represents a potential future scenario rather than an immediate forecast.

On-Chain Metrics Reach Unprecedented Levels
Beyond price action, Solana’s blockchain metrics paint an impressive picture. The network processed $1.1 trillion in aggregate economic activity throughout Q1 2026, marking Solana’s inaugural trillion-dollar quarter according to Artemis analytics.
To put this in perspective, Q3 2025 registered approximately $600 billion while Q4 2025 reached roughly $850 billion. This represents a substantial 29% increase quarter-over-quarter.
Daily active addresses currently range between 5.5 and 5.8 million, representing a significant climb from the 3–4 million baseline observed throughout late 2025. Address activity even momentarily peaked between 6.5 and 7 million during earlier portions of Q1.
Solana dominated all major blockchain networks in Q1 2026 transaction volume, executing 25.3 billion transactions throughout the three-month period.
Transaction Volumes Experience Dramatic Surge
Daily transfer volumes, which typically fluctuated between $5 and $15 billion during late 2025, recently exploded toward the $70–$75 billion territory.
The PreStocks DEX operating on Solana also established a new single-day volume benchmark of $28.65 million.
Despite this impressive on-chain activity, SOL’s market price has yet to mirror the underlying network expansion. While capital flows intensify, corresponding price appreciation remains absent—for now.
SOL’s current market behavior shows it challenging resistance near $84, with the $78–$81 range serving as the critical support foundation that must hold.
Get 3 Free Stock Ebooks
Discover top-performing stocks in AI, Crypto, and Technology with expert analysis.
- Top 10 AI Stocks - Leading AI companies
- Top 10 Crypto Stocks - Blockchain leaders
- Top 10 Tech Stocks - Tech giants


