
 Surges Past $76K Amid 46-Day Negative Funding Rate Streak")
Key Takeaways
- BTC reached $76,120 on Tuesday before consolidating near $74,400
- Perpetual funding rates remained negative for 46 consecutive days, mirroring post-FTX conditions
- Spot Bitcoin ETFs in the United States recorded $411.41 million in net inflows Tuesday
- Daily transaction volumes surged 62% year-to-date in 2026, reaching 17-month peaks
- Market analyst CW8900 identifies “bull market behavior” across network metrics
Bitcoin (BTC) surged to an intraday peak of $76,120 on Tuesday, marking its strongest price level in 70 days, before settling back to approximately $74,400. The upward movement stemmed from a combination of strengthening on-chain metrics, substantial exchange-traded fund capital flows, and reduced geopolitical uncertainty.
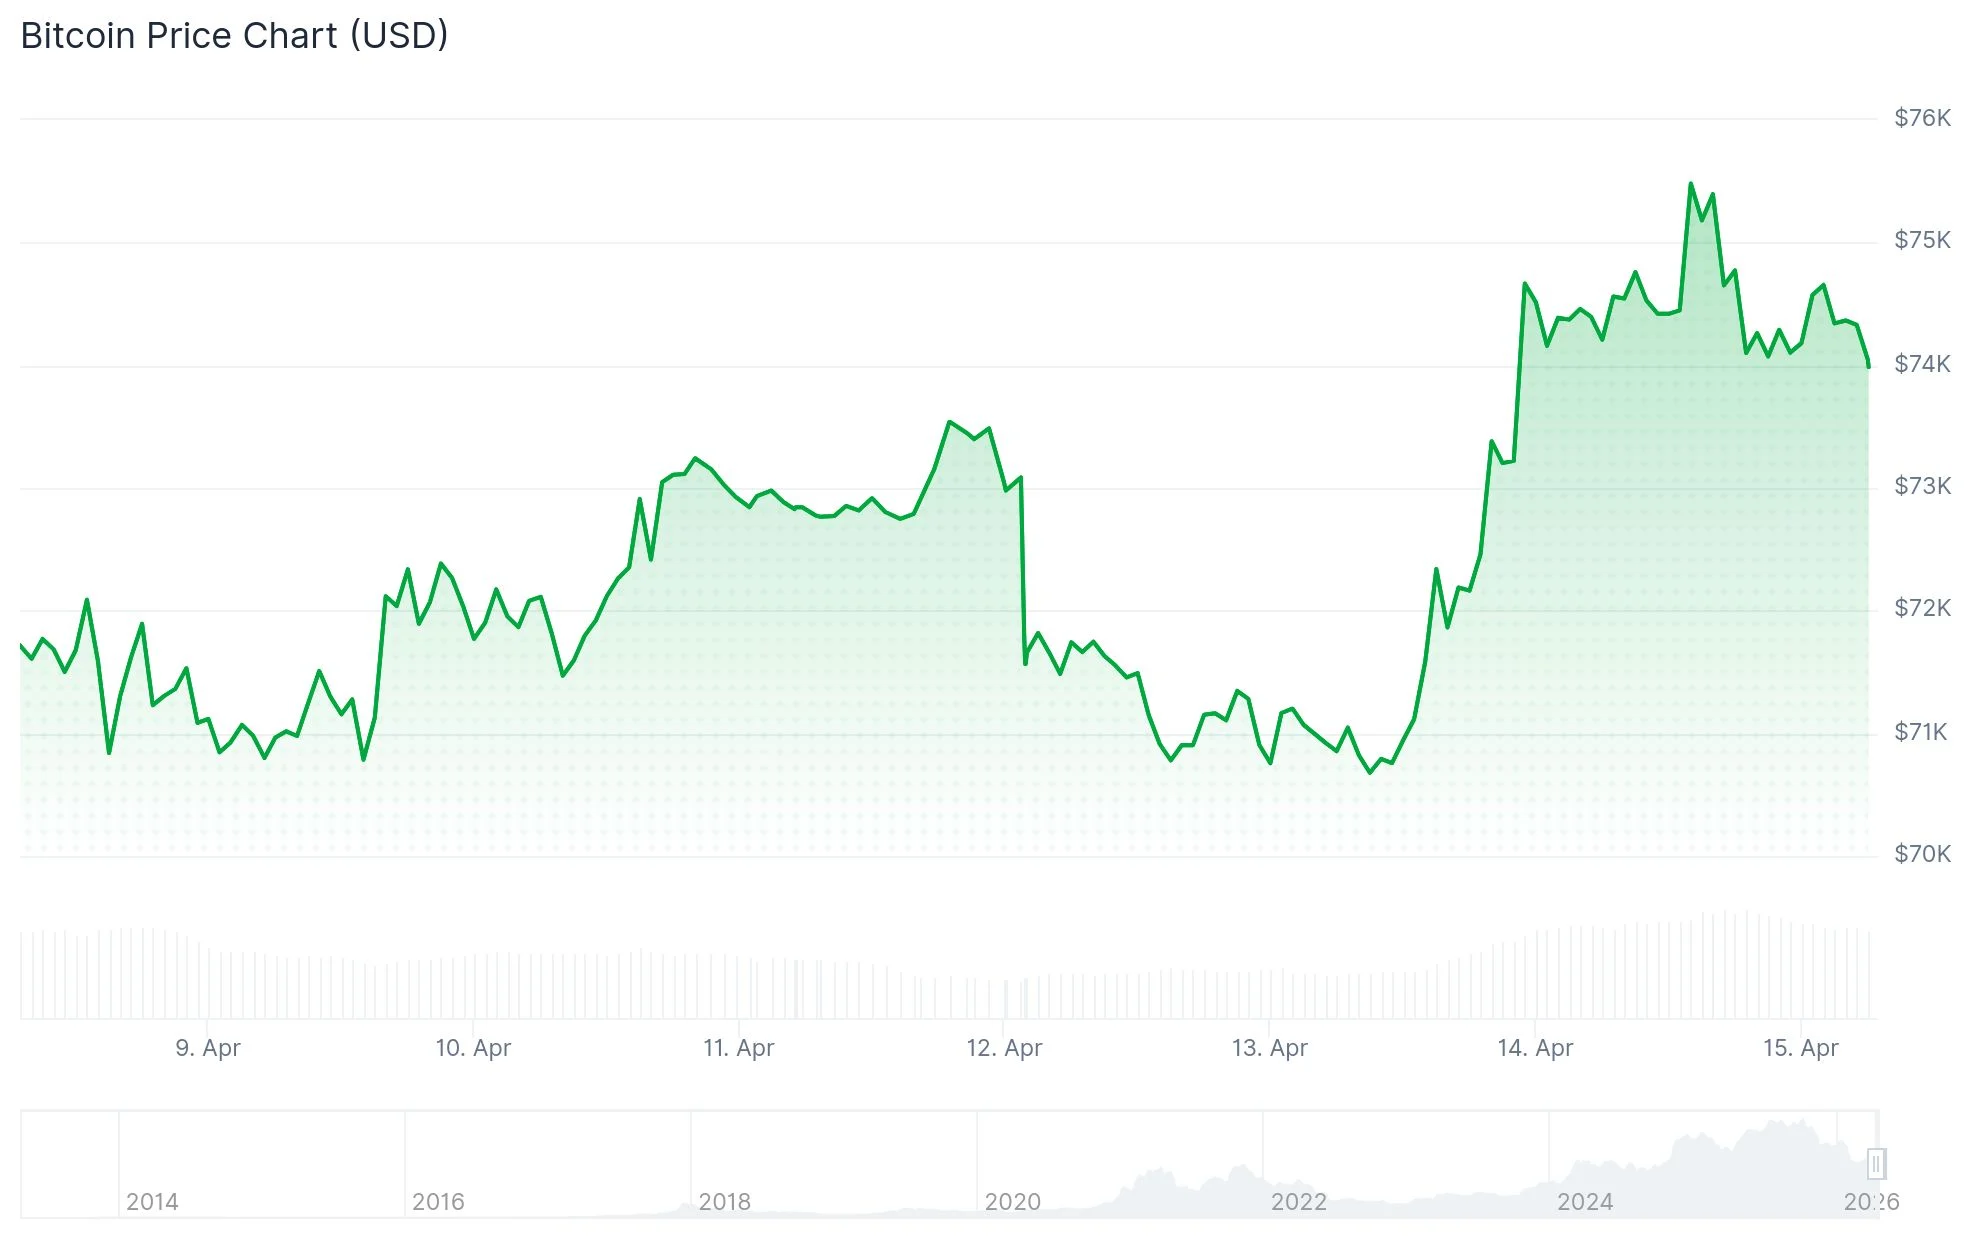
The $76,000 threshold has functioned as a critical resistance barrier for more than two months. Bitcoin momentarily pierced this level before encountering selling pressure, prompting market participants to monitor whether buyers can establish a sustained foothold above this zone.
From a technical analysis perspective, Bitcoin successfully breached the upper boundary of an ascending triangle formation at $73,000 during Monday’s trading session. A definitive daily candle close above $75,000 would solidify this breakout pattern. Following this confirmation, the subsequent resistance zones are positioned at $80,000, with the pattern’s projected target extending toward $89,050.
The daily Relative Strength Index has advanced to 63, recovering from deeply oversold territory at 15 recorded in early February. Meanwhile, the MACD histogram continues expanding positively, suggesting sustained bullish momentum for the near-term outlook.
Cryptocurrency analyst CryptoBlockto highlighted on X that Bitcoin “surged above the $76,000 level, breaking above its March highs and signaling renewed bullish momentum.” The analyst emphasized that sustaining prices above $76,000 would validate a complete trend reversal.

Network Transaction Activity Reaches 17-Month Peak
Bitcoin’s daily transaction volume has increased 62% throughout 2026 to date, hitting 765,130 transactions on April 5. This activity level mirrors the intensity observed in November 2024, when Bitcoin initially breached the $100,000 milestone.
Market analyst CW8900 shared on X: “$BTC daily transaction count is higher than when $BTC was $120K. The network is showing bull market behavior.”
Aggregate fee volume has likewise expanded by 4% during the previous week, reaching $153,700. Glassnode characterized this development as reflecting “heightened on-chain demand,” indicating that network participants are increasingly willing to compensate miners more generously for transaction processing priority.
ETF Capital Flows and Extended Negative Funding Patterns
United States spot Bitcoin ETFs attracted $411.41 million in net capital on Tuesday, reversing a $291.11 million withdrawal recorded Monday. Combined net assets under management across Bitcoin ETF products currently total $94.09 billion, with aggregate net inflows reaching $57.28 billion.
Vetle Lunde, research director at K33 Research, highlighted that funding rates for Bitcoin perpetual contracts on Binance have maintained negative territory for 46 consecutive days, even as open interest continues expanding. This dynamic indicates traders are establishing fresh short positions rather than closing existing ones.
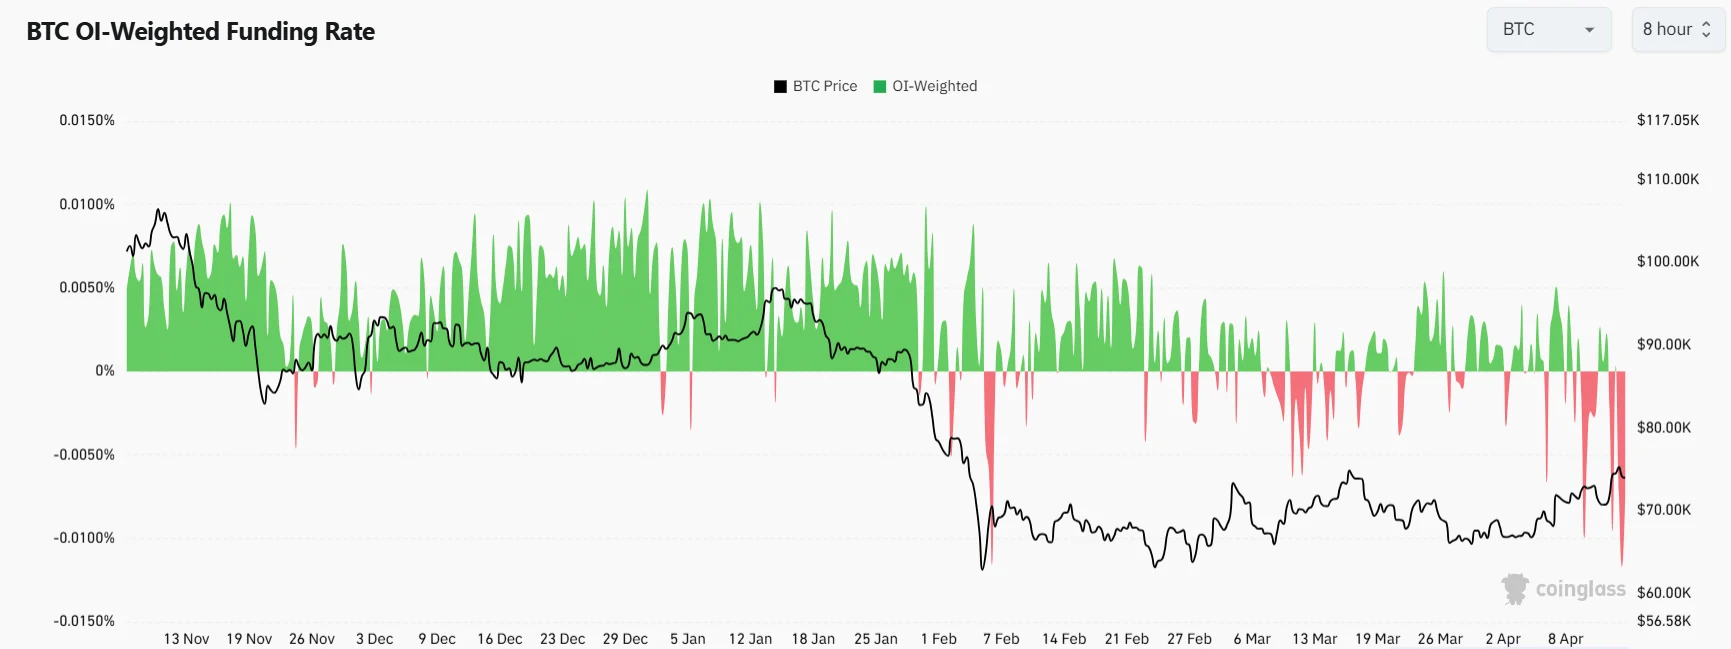
“Comparable risk-off regimes have historically been attractive entry points for BTC,” Lunde observed. The previous instance of funding rates remaining negative for this extended duration occurred following the FTX collapse in late 2022, which ultimately established that cycle’s market bottom.
Should sellers reassert control, immediate support lies at the 50-day exponential moving average near $71,021, with additional downside objectives identified at $68,950 and $67,412.
Get 3 Free Stock Ebooks
Discover top-performing stocks in AI, Crypto, and Technology with expert analysis.
- Top 10 AI Stocks - Leading AI companies
- Top 10 Crypto Stocks - Blockchain leaders
- Top 10 Tech Stocks - Tech giants


