
 Price Hovers at Critical Support: What’s Next for ETH?")
Key Takeaways
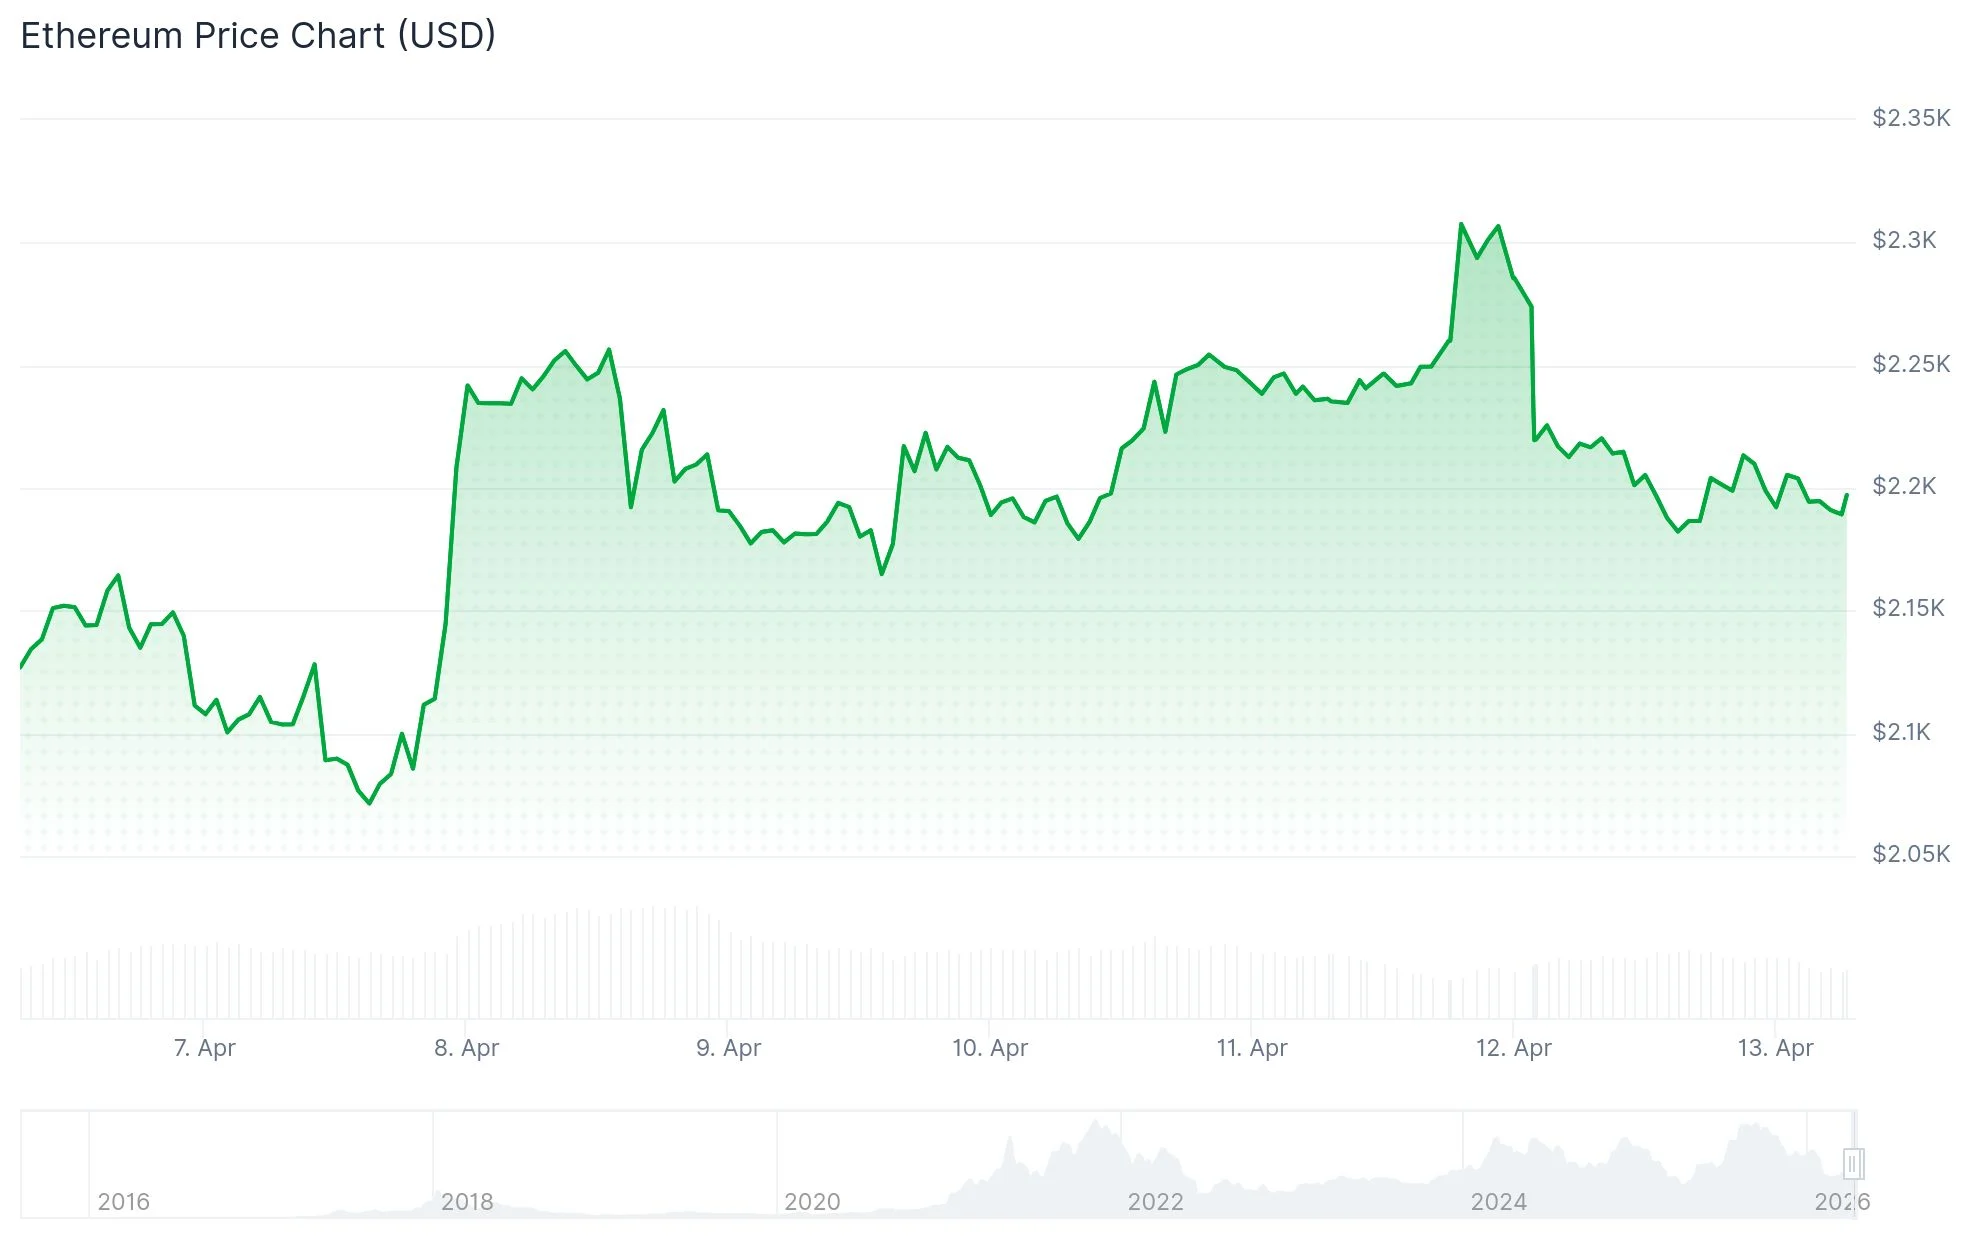
- Ethereum is currently priced at $2,181, hovering near critical support between $2,150 and $2,200.
- Breaking below $2,150 may trigger a decline toward the $2,000 psychological support level.
- Technical indicators show RSI at 53.53, with ETH positioned above 20-day and 50-day moving averages but trailing the 100-day and 200-day.
- Long-term analysis from Ali Charts identifies significant support zones at $1,550 and $1,070 if current levels collapse.
- Maintaining current support could enable a rebound toward $2,400, with further upside potential at $2,624.
Ethereum has arrived at a pivotal price point that market participants are monitoring with heightened attention. Current data shows ETH changing hands at $2,181.19, representing a 2.89% decline in the last 24-hour period. Daily trading activity has reached $28.19 billion, while the asset maintains a market capitalization of $263.38 billion.
Market observers are concentrating their attention on the $2,150–$2,200 range. Market analyst Ted highlighted on X that Ethereum momentarily approached a breakdown beneath $2,200, influenced by defensive positioning throughout worldwide financial markets. According to his assessment, this range represents where purchasing activity is expected to intensify.
Should ETH maintain positioning above $2,150, the immediate trajectory suggests sideways movement with potential advancement toward $2,400. This threshold represents the primary resistance obstacle. Following that barrier, technical analysis identifies a subsequent objective near $2,624.
Conversely, a breach of the $2,150 threshold would establish $2,000 as the next downward target — a significant whole-number benchmark that has previously served as psychological support.
Technical Metrics Present Neutral Outlook
From a technical perspective, the Relative Strength Index registers 53.53, marginally exceeding the baseline of 53.40. This measurement suggests mild bullish sentiment without displaying decisive momentum in either direction.

The cryptocurrency is positioned above both its 20-day SMA ($2,117.30) and 50-day SMA ($2,080.00), indicating that short-term support structures remain intact. Nevertheless, the price continues trading beneath the 100-day SMA at $2,360.14 and the 200-day SMA at $2,918.05. This configuration places the extended trend in a comparatively vulnerable state.
The MACD indicator sits marginally above its signal line, potentially suggesting preliminary stabilization. However, market analysts emphasize that additional accumulation activity is required before confirming a definitive reversal.
Long-Term Chart Reveals $1,550 and $1,070 Zones
Market analyst Ali Charts shared a weekly chart on X demonstrating that Ethereum could still be operating within a parallel channel structure. The analysis identifies two critical downside targets worth monitoring at $1,550 and $1,070.
These figures aren’t arbitrary — both correspond with historical reaction zones visible on the weekly timeframe. The $1,550 threshold would represent the initial significant floor should current support levels fail. Beneath that point, $1,070 emerges as the deeper support foundation.
The daily timeframe additionally reveals that losing the $2,155 region would establish approximately $2,015 as the subsequent destination. Further down, the chart structure indicates $1,775 as an additional support area.
As of April 13, 2026, Ethereum is valued at $2,181.19, with the $2,150 threshold serving as the decisive boundary for near-term price movement.
Get 3 Free Stock Ebooks
Discover top-performing stocks in AI, Crypto, and Technology with expert analysis.
- Top 10 AI Stocks - Leading AI companies
- Top 10 Crypto Stocks - Blockchain leaders
- Top 10 Tech Stocks - Tech giants


