
 Shows Critical Undervaluation Signal That Previously Led to 100% Gains")
Key Takeaways
- Ethereum has climbed 6.5% over the last month, leading Bitcoin and XRP in performance metrics
- The Capriole Macro Index Oscillator registers -2.42, marking ETH’s entry into a historically undervalued territory unseen since the 2022 bear market
- MVRV Ratio improved from -42% in early February to -27.5%, mirroring previous cycle bottom formations
- April’s spot cumulative volume delta reached 184,500 ETH, confirming organic buying pressure rather than leveraged speculation
- Critical resistance levels identified at $2,225–$2,265, with potential upside toward $2,400–$2,500 contingent on maintaining $2,140 support
Ethereum is currently holding firm above the $2,200 threshold following a robust 6.33% surge that enabled the asset to breach the $2,150 resistance zone. Market participants now have their sights set on retesting the March peak around $2,385.
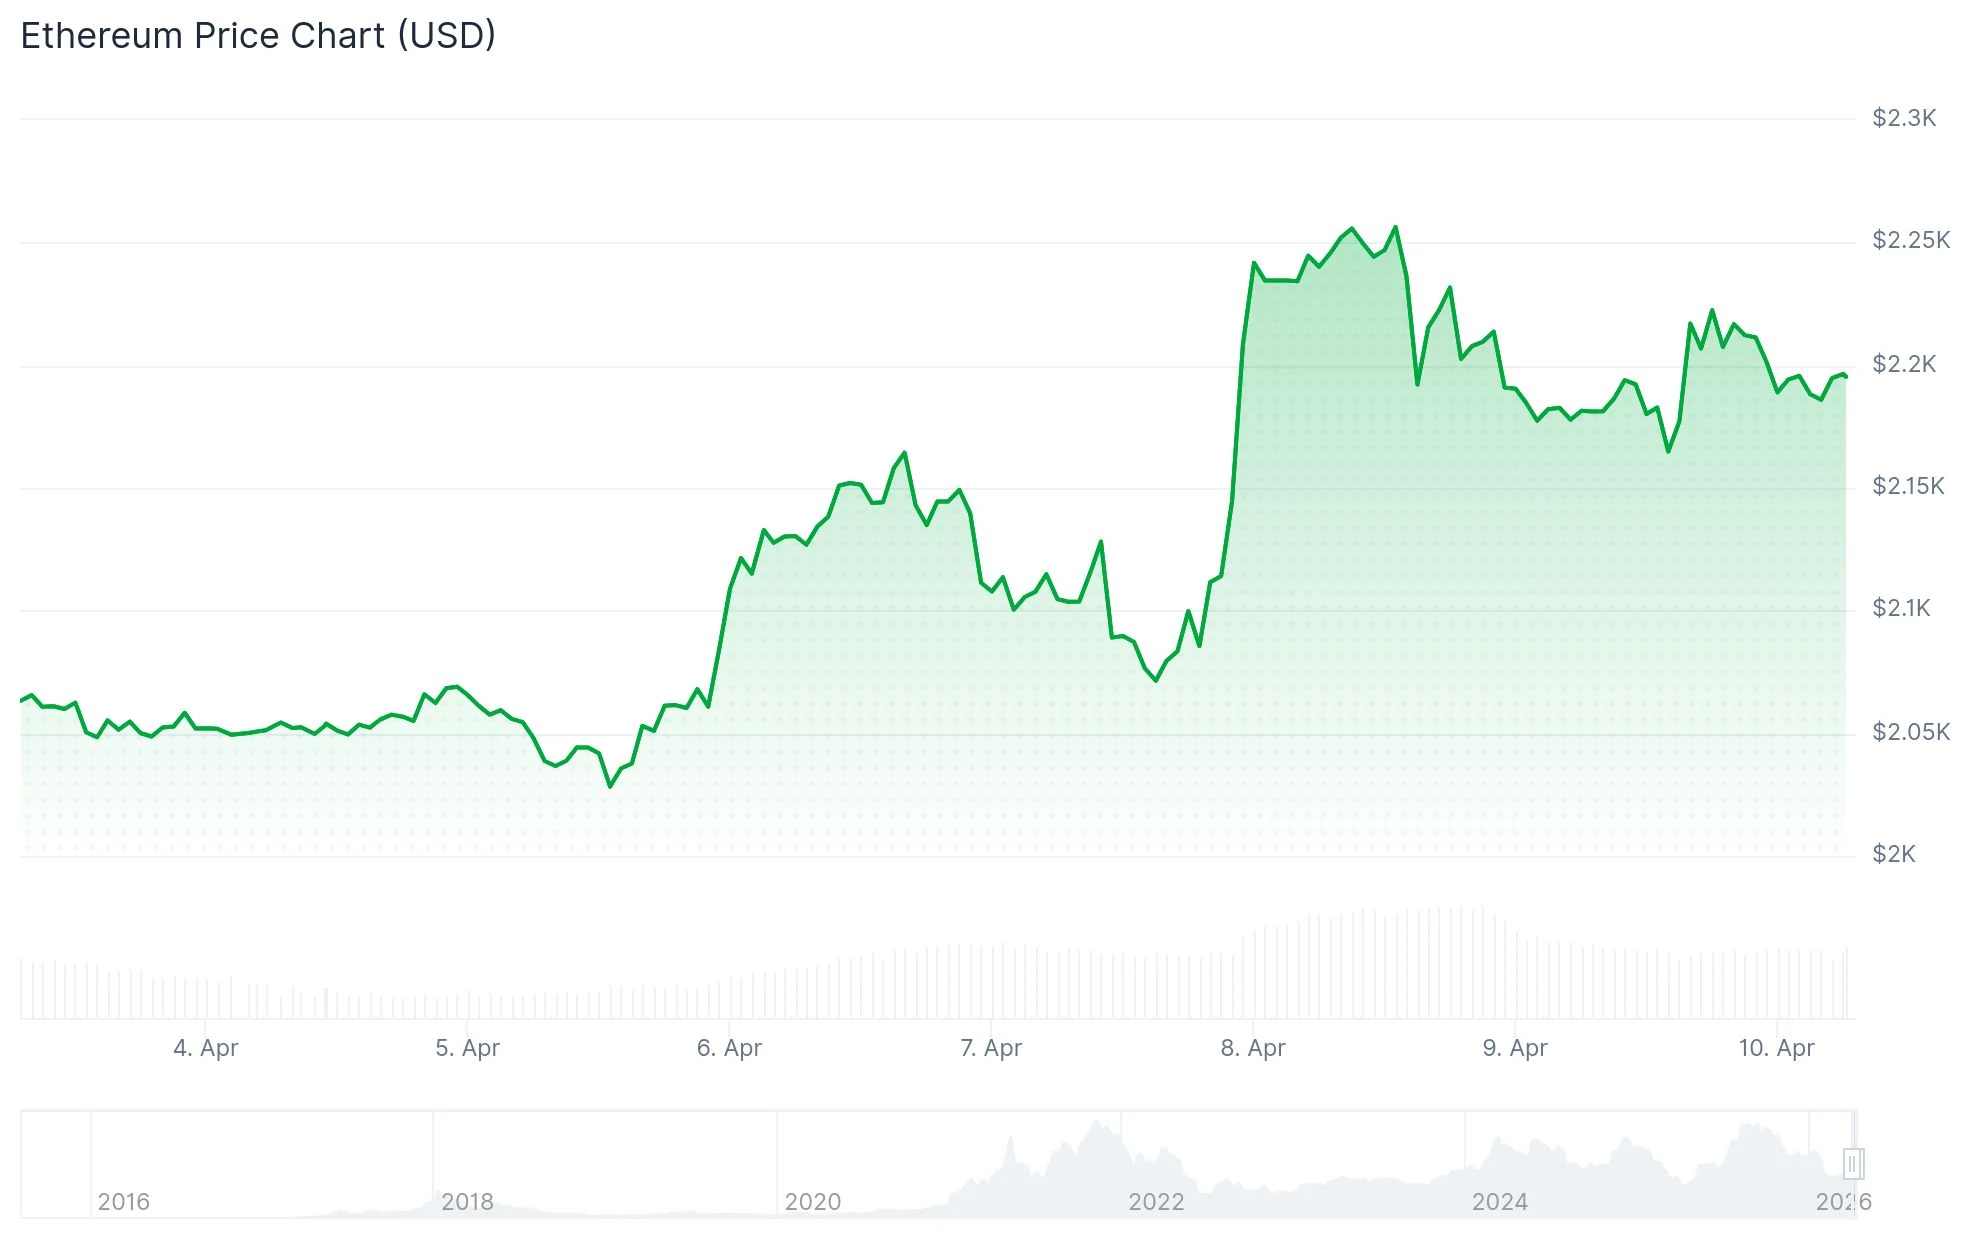
Analyzing the trailing 30-day performance reveals ETH as the dominant force within the top five digital assets by market capitalization, posting gains of 6.5%. Meanwhile, Bitcoin managed only a modest 1.4% increase during this timeframe, and XRP experienced a decline of 4.7%.
The broader cryptocurrency ecosystem received a significant catalyst when President Donald Trump revealed a ceasefire agreement with Iran. This geopolitical development caused oil prices, which had surged to $117 per barrel, to retreat below the $100 mark. The Crypto Fear and Greed Index responded by advancing from 23 (indicating Fear) to a balanced 47.
Spot ETF capital flows returned to positive territory, though momentum remained subdued with only $36 million entering the market across the initial three trading sessions of the week.
Historical Macro Indicator Signals Deep Undervaluation
The Capriole Macro Index Oscillator currently registers -2.42 for Ethereum, marking a depth unseen since the 2022 market bottom. This comprehensive metric synthesizes investment patterns, market cycle positioning, and blockchain-based analytics. Historically, significantly negative values have correlated with capitulation phases and subsequent price recoveries.

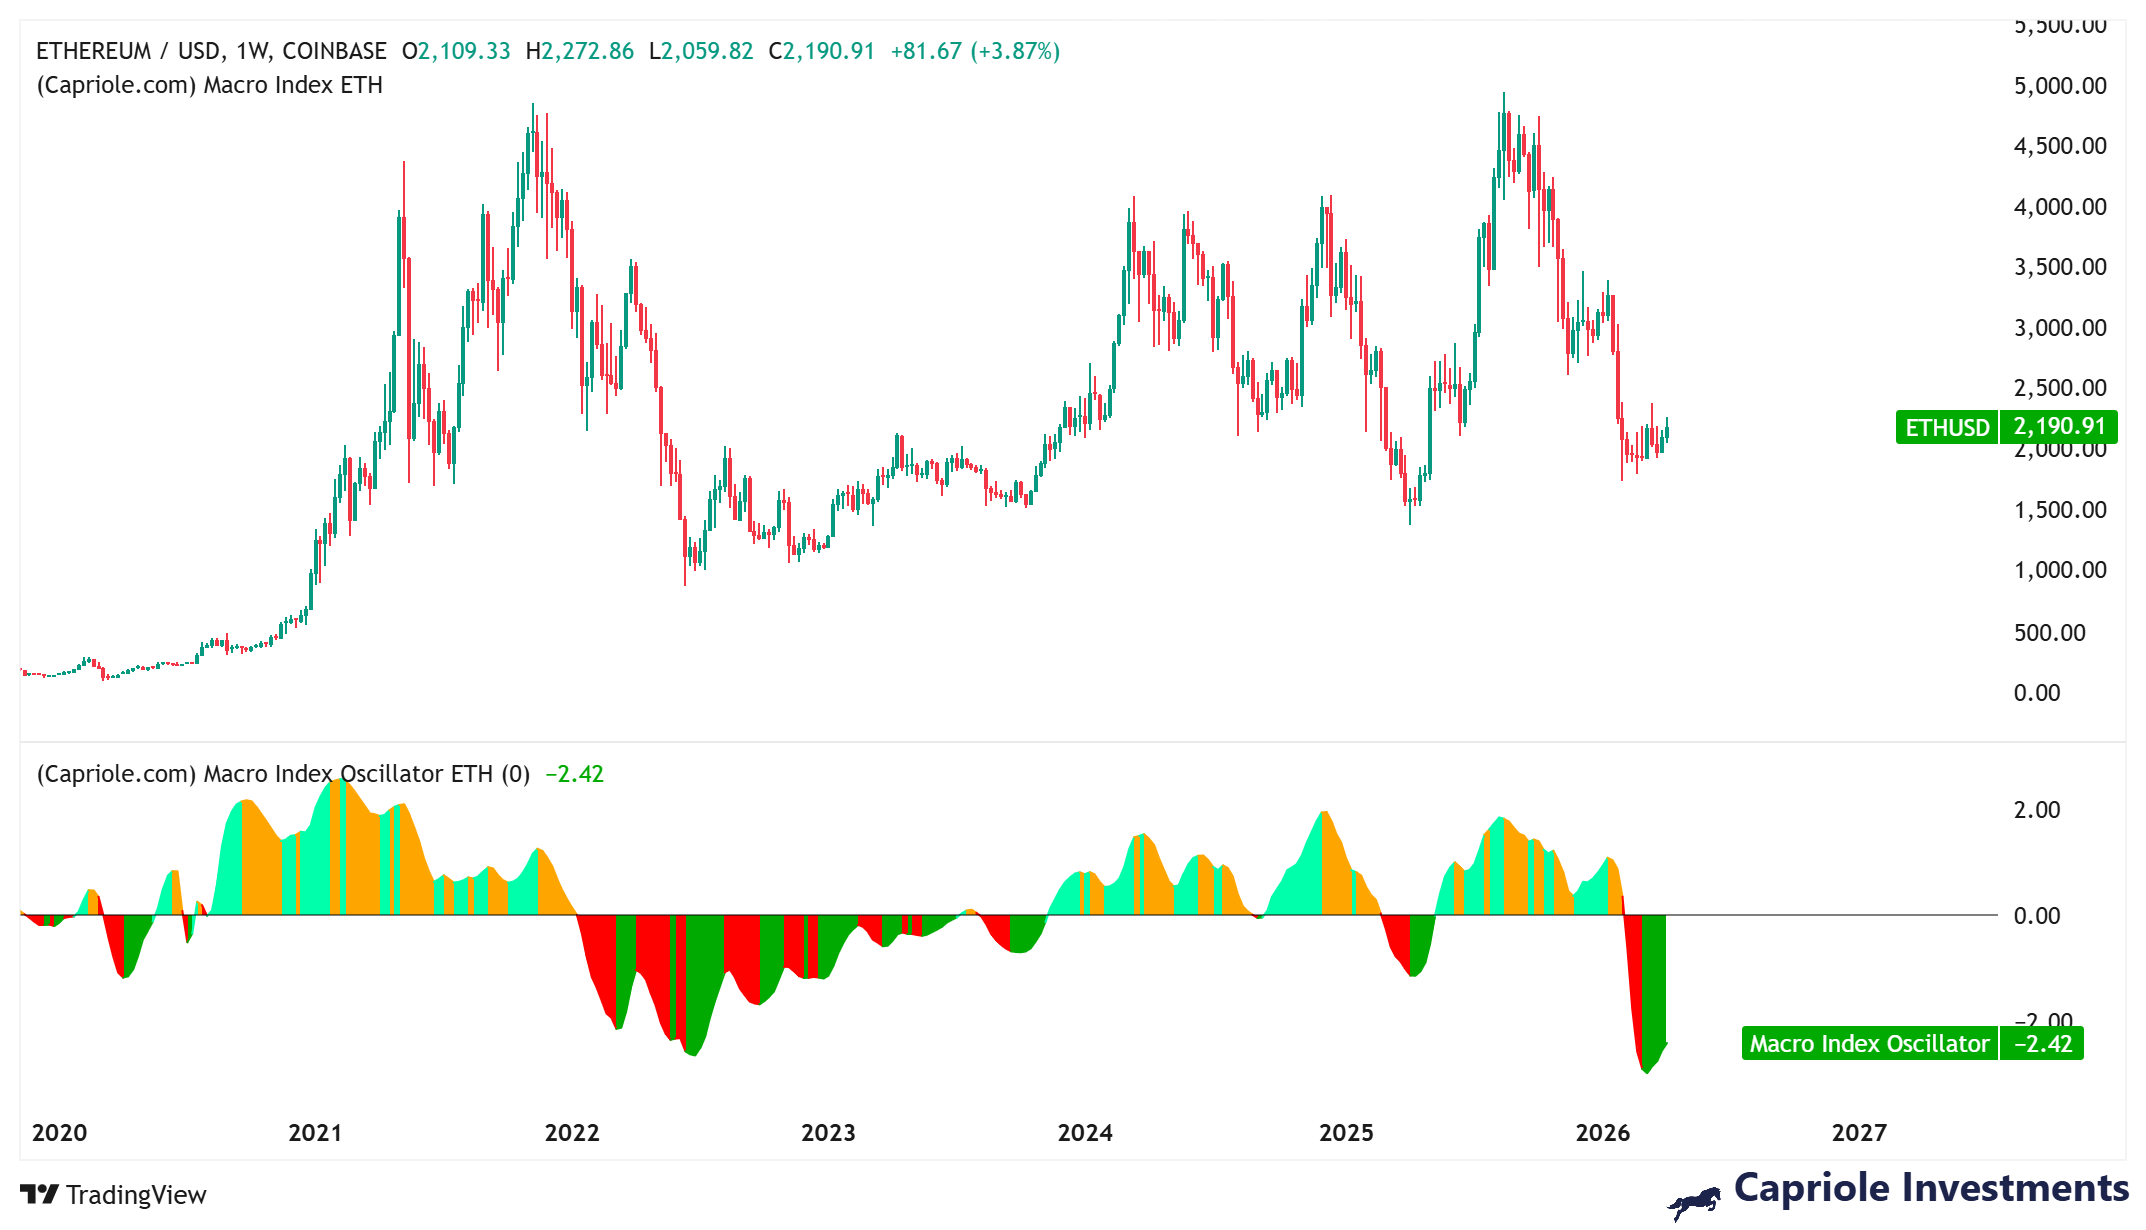
During the summer of 2022, Ethereum established its floor between $1,000 and $1,200 when this oscillator touched -2.2. Subsequently, in late 2023, a descent to -1 preceded ETH’s breakout rally from the $1,500 range.
MVRV Ratio Demonstrates Classic Recovery Formation
The Market Value to Realized Value (MVRV) Ratio, which measures the relationship between current market capitalization and aggregate investor cost basis, plummeted to -42% during the opening weeks of February. Since then, it has recovered to -27.5%. This trajectory bears striking resemblance to April 2025’s pattern, when ETH established a bottom near $1,400 before initiating a significant rally.
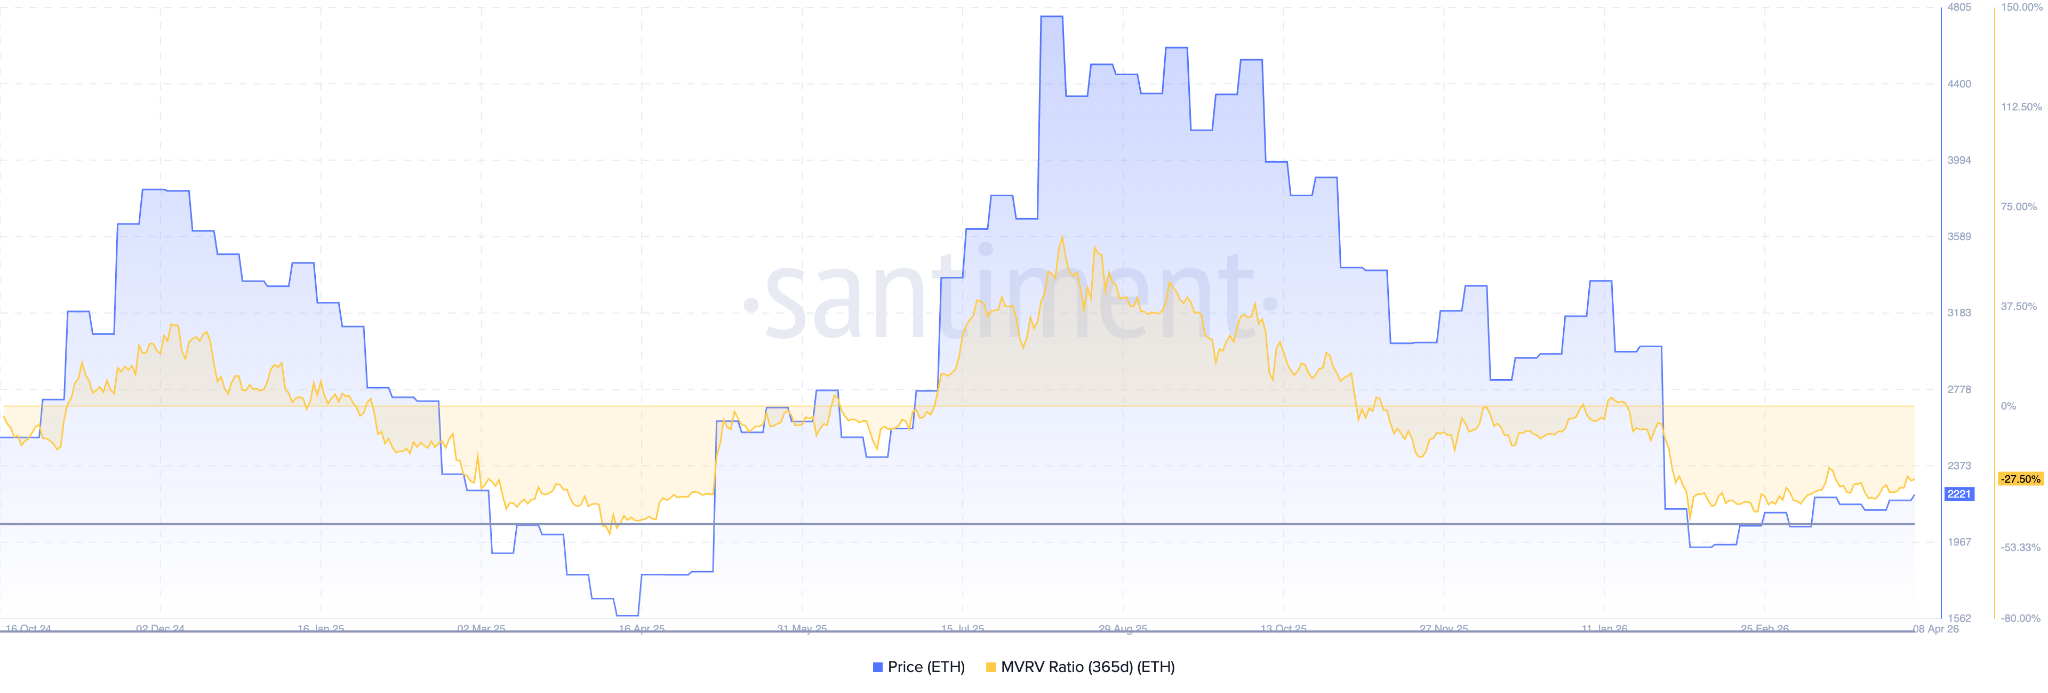
Historical data indicates that when the MVRV Ratio previously crossed back into positive territory, Ethereum experienced a 70% appreciation within a two-month period.
Crypto analyst sunmoon observed that Ethereum’s taker buy/sell ratio has maintained an upward trajectory spanning four to five months. According to the analyst’s assessment, this configuration resembles the accumulation phase that preceded the April–May 2025 bullish move.
Genuine spot market demand underpins the current price action. The consolidated spot cumulative volume delta (CVD) for April stands at 184,500 ETH. Futures CVD has similarly advanced steadily to 4.36 million ETH. The funding rate maintains a positive 0.0052, while open interest hovers around 4.75 million ETH — demonstrating range-bound behavior with minimal excessive leverage deployment.
Examining the four-hour timeframe reveals that ETH has established a pattern of ascending lows. Immediate resistance materializes at $2,225, followed by $2,265. A decisive move beyond $2,265 would clear the pathway toward $2,320 and possibly the $2,400–$2,450 zone.
Should ETH surrender the $2,140 threshold, immediate support emerges at $2,110, with the primary demand zone positioned near $2,060.
Get 3 Free Stock Ebooks
Discover top-performing stocks in AI, Crypto, and Technology with expert analysis.
- Top 10 AI Stocks - Leading AI companies
- Top 10 Crypto Stocks - Blockchain leaders
- Top 10 Tech Stocks - Tech giants


