
 Price Rallies as Bulls Regain Market Dominance Above $2,000")
Key Highlights
- ETH maintained its position above the $2,000 threshold while derivatives metrics indicated increasing buying momentum.
- Taker volume in the net category has sustained positive territory since the beginning of March 6, reflecting heightened buyer engagement.
- Open interest in futures contracts expanded to 6.4 million ETH, nearing the previous year’s highest level.
- Exchange-traded funds tracking spot Ether attracted $120 million in net capital, marking the strongest single-day performance since the middle of March.
- Market observers emphasized that maintaining the $2,000 level is crucial, while identifying secondary support between $1,750 and $1,800.
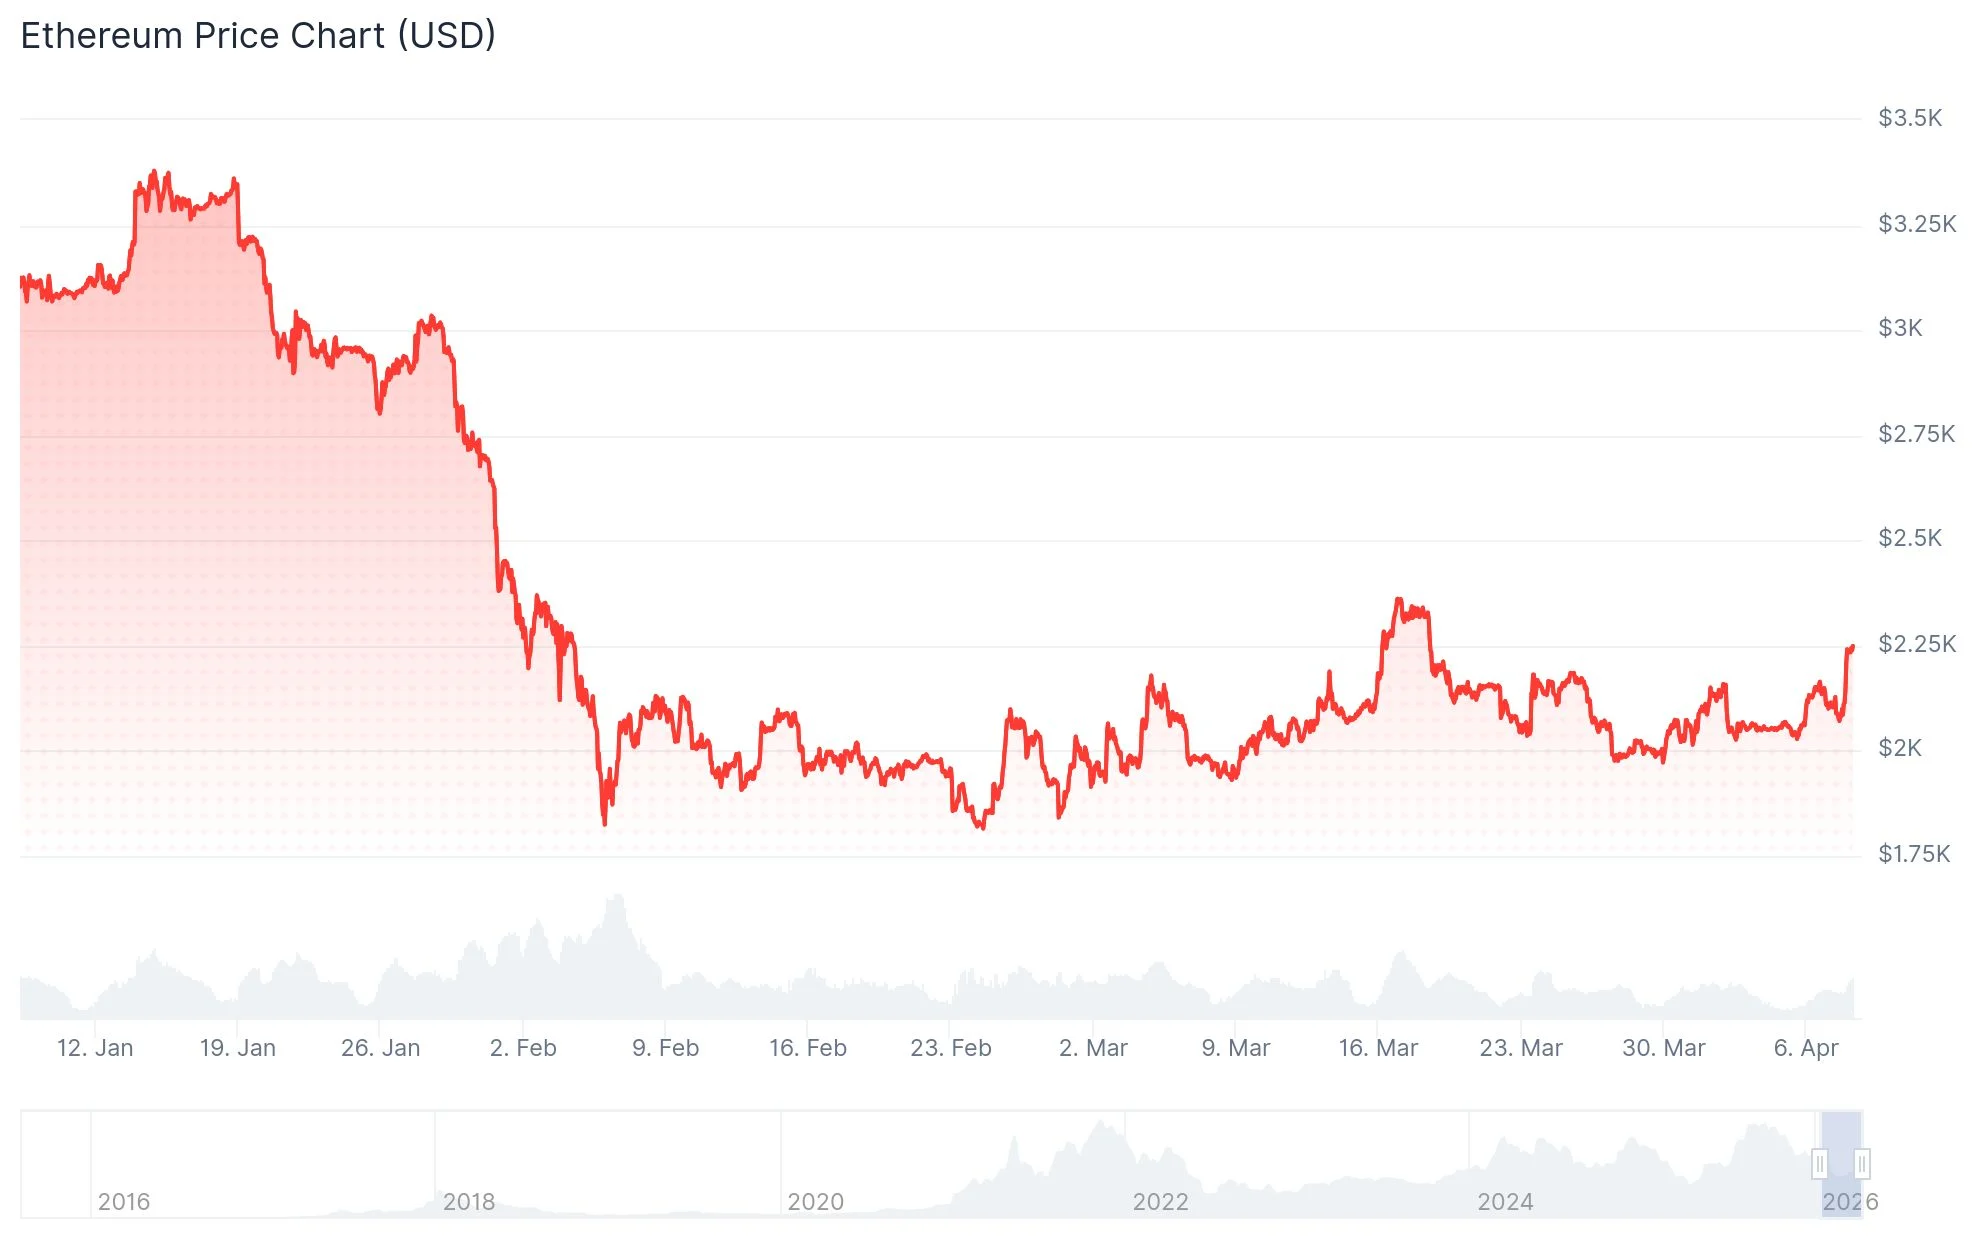
Ethereum (ETH) was changing hands near $2,249 following an upward push by buyers who successfully protected the critical $2,000 support zone. Fresh market indicators point toward strengthening demand conditions.
Market analysts monitoring derivatives markets reported that purchasing activity is now dominating the landscape. This transition has sparked discussions about a potential trend reversal.
The net taker volume indicator has maintained positive readings continuously since early March. This measure reveals whether aggressive purchasing or selling forces are dominating derivatives exchanges.
Market observer Darkfost highlighted that buying momentum continues to dominate with net taker volume registering $104 million. He noted this represents the first occurrence of such a derivatives market shift for Ethereum since the previous bear cycle ended.
Futures Activity and ETF Capital Flows Signal Strengthening Interest
The analyst further explained that this configuration could facilitate upward momentum if sustained alongside improved spot market demand. Rising futures participation provides additional confirmation of this outlook.

Open interest across Ethereum futures markets increased to 6.4 million ETH. This figure approaches the record peak of 7.8 million ETH established in July 2025.
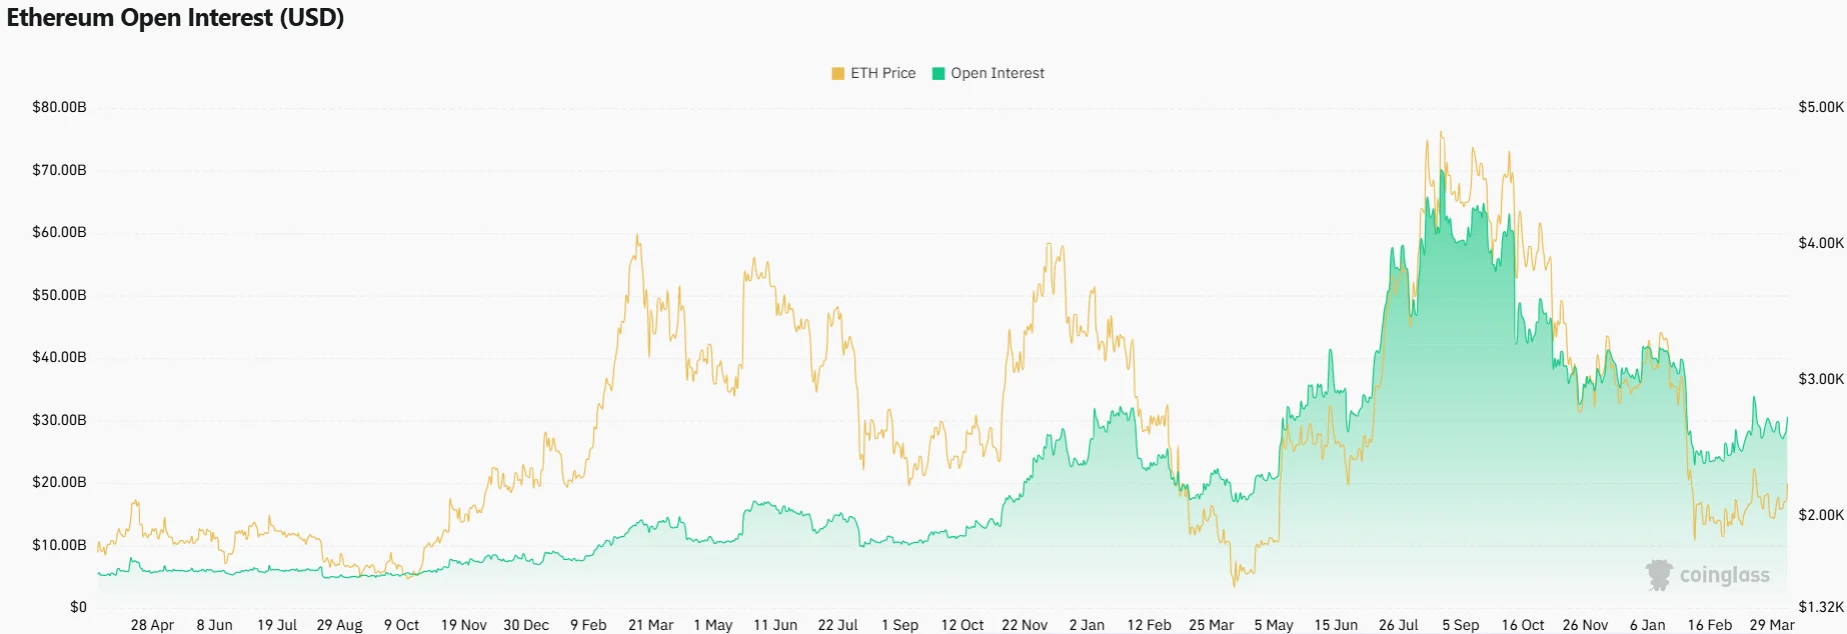
After declining to 5 million ETH during October, open interest has since rebounded. This recovery demonstrates continued engagement in derivatives trading venues.
Investment products tracking spot Ether also exhibited a reversal in capital flows. These vehicles attracted $120 million in net deposits on Monday, representing the largest daily influx since the middle of March.
This influx arrived after a brief period of withdrawals. The renewed capital inflow indicates that institutional investors based in the United States have resumed accumulation.
Ethereum’s price registered a near-term advance beyond $2,250 before encountering resistance. Examining the hourly timeframe reveals that price action pierced through a descending triangle resistance line situated near $2,150 prior to pulling back slightly.
The Significance of the $2,000 Price Level
Market technicians indicated that Ethereum’s technical framework remains favorable provided the support band spanning $1,800 to $2,000 continues holding. This zone coincides with the 20-day exponential moving average and the bottom boundary of a symmetrical triangle pattern.
Analyst Ted Pillows suggested that Ethereum may launch another upward leg if the $2,000 mark remains intact. Conversely, he warned that breaking below this threshold could trigger a decline toward a fresh annual low.
Analysis of holder cost basis data confirms that the $2,000 vicinity represents a significant support concentration. Over 3.5 million ETH tokens were accumulated around this price point.
Beneath this level, an additional demand cluster exists between $1,750 and $1,800, where approximately 1.36 million ETH changed hands. Should this zone fail to hold, the triangle pattern projects a downside target near $1,460.
In a social media post, analyst Ali Charts observed that Ethereum’s 0.80 MVRV band is positioned around $1,880. He noted that this price level has traditionally marked zones where selling pressure diminishes and long-term holders increase their positions.
Looking at near-term price action, key support levels include $2,220, $2,165, and $2,120. Overhead resistance is located near $2,250 and $2,275, with the current price structure maintaining stability above the $2,200 zone.
Get 3 Free Stock Ebooks
Discover top-performing stocks in AI, Crypto, and Technology with expert analysis.
- Top 10 AI Stocks - Leading AI companies
- Top 10 Crypto Stocks - Blockchain leaders
- Top 10 Tech Stocks - Tech giants


