
 Price Eyes Critical $2,150 Breakout After Reclaiming $2,100 Support")
TLDR
- ETH has climbed past $2,080 with immediate resistance positioned at $2,150
- The $2,000 price zone represents crucial support — a breach could spark significant long liquidations
- Breaking through the $2,150–$2,180 range may unlock a path toward $2,220–$2,350
- Long-term technical analysis reveals an ascending channel pattern established since 2022
- Crypto analyst Ali Charts identifies $1,551 and $1,070 as major downside support zones if the channel structure fails
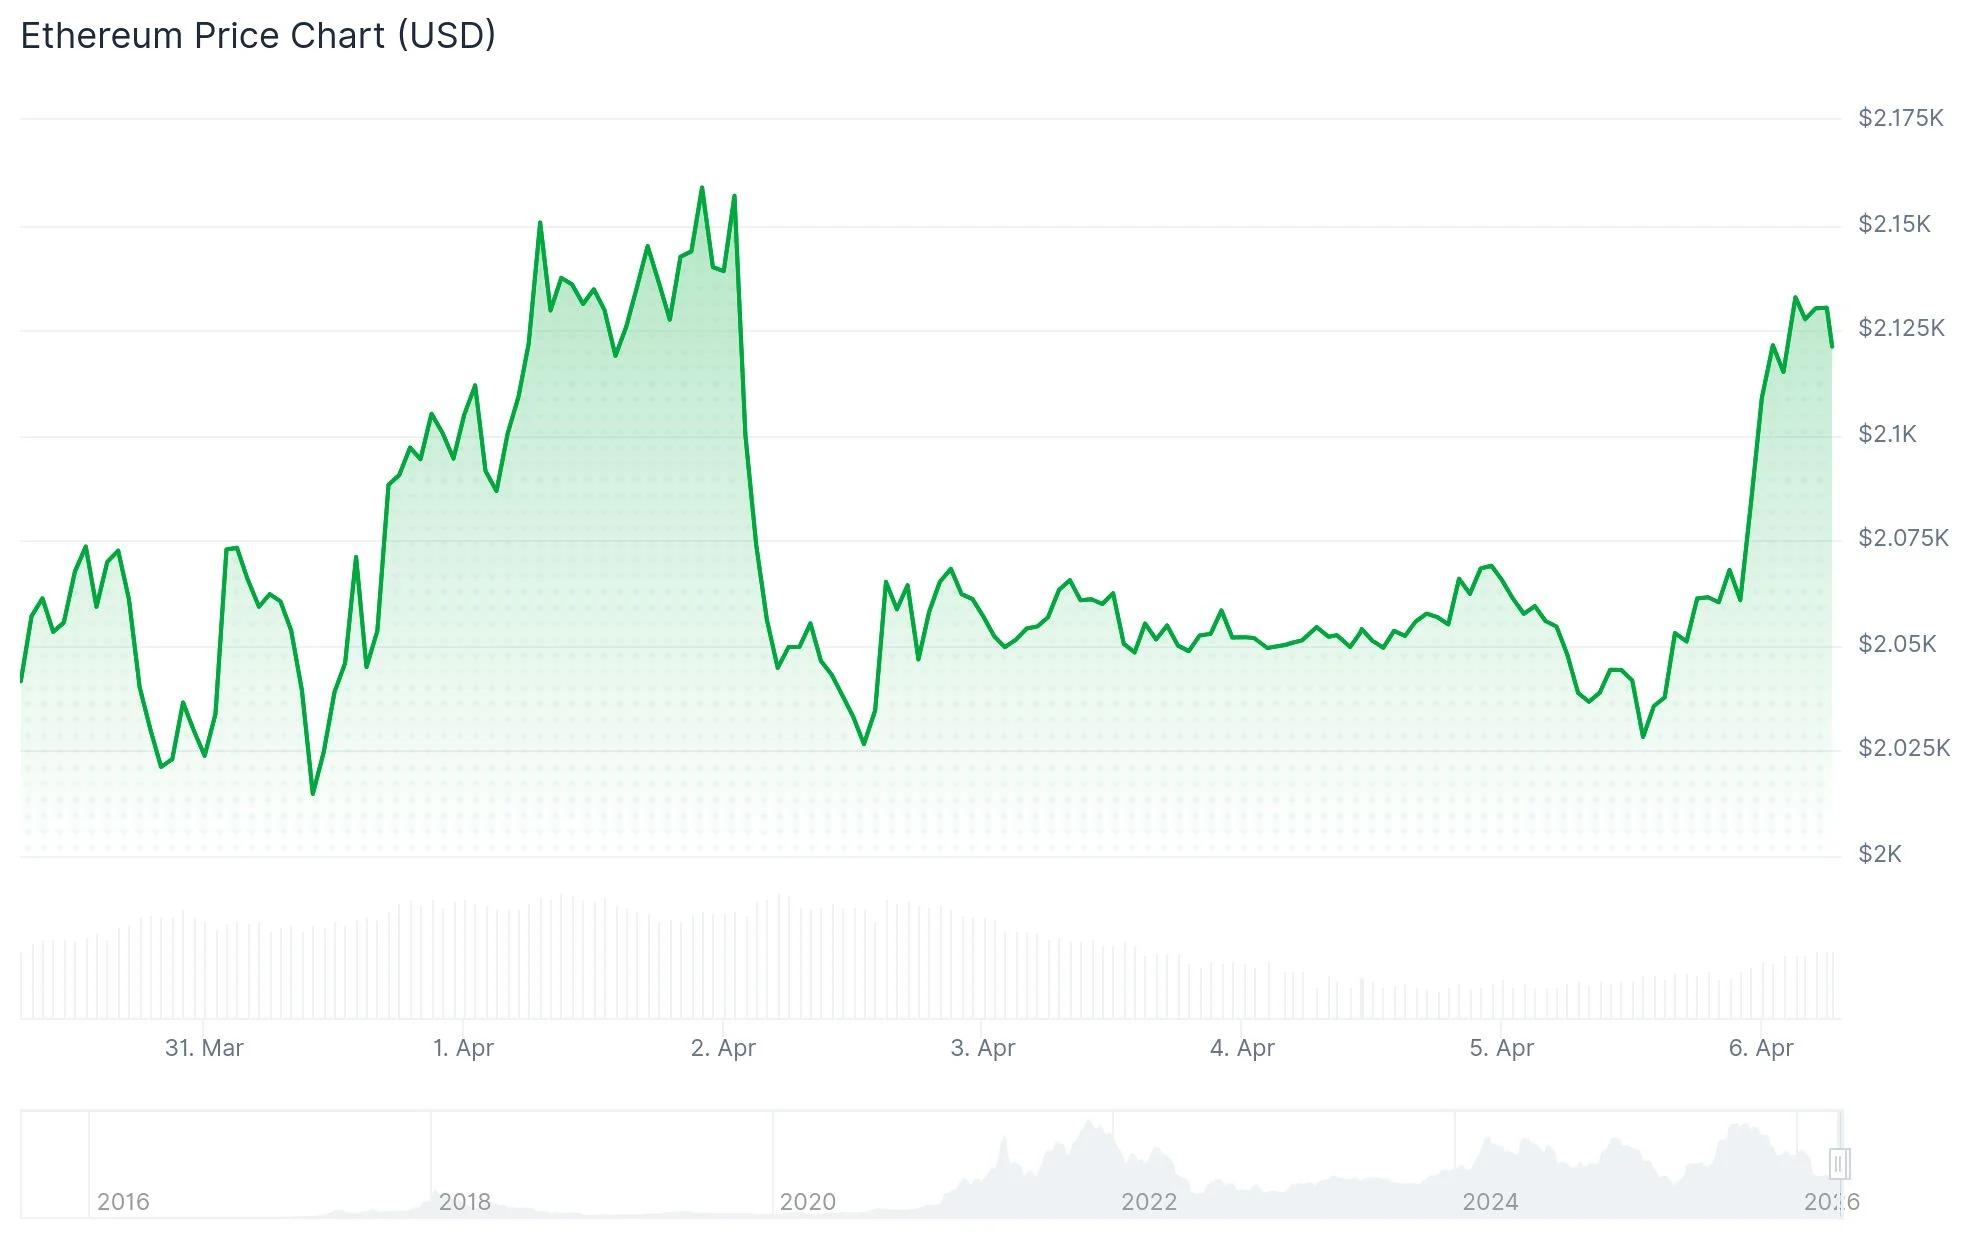
Ethereum has successfully climbed above the $2,080 mark following a rebound from lows around $2,017. The digital asset has breached a significant downward trend line at $2,065 visible on the hourly timeframe and now trades comfortably above its 100-hour Simple Moving Average.
This upward move carried ETH beyond the 50% Fibonacci retracement of the decline from $2,168 down to $2,017. The price now approaches the 83.2% Fibonacci level situated near $2,140, which aligns with the primary resistance area.
Market participants are closely monitoring $2,150 as the critical threshold. This price point has repeatedly acted as a barrier, establishing itself as a significant near-term obstacle. For the recovery to maintain momentum, bulls must achieve a decisive break above this zone.
Should ETH successfully breach $2,150, the subsequent resistance emerges at $2,180. Clearing that hurdle could bring $2,220 into focus, with additional targets at $2,350 and $2,380 on the horizon.
What Happens if ETH Fails at $2,150?
In the event that price action stagnates at $2,150, the first line of defense appears at $2,080, with secondary support at $2,065. A breakdown beneath $2,065 might drive ETH back toward $2,020, potentially extending to $1,980 and $1,965 on further weakness.

Market analyst Ted has emphasized the significance of the $2,000 threshold. A decisive move below this psychological level could initiate substantial liquidation activity, as numerous leveraged long positions are believed to be concentrated around this price point. Such forced selling pressure could accelerate downward momentum toward $1,755 or even $1,693.
The near-term trading range appears clearly established. Ethereum is either consolidating for a breakout beyond $2,150 or facing the prospect of a more pronounced decline should the $2,000 support level fail to hold.
Long-Term Chart Still Points Higher
From a broader perspective, technical analyst James Easton UK has highlighted a chart depicting Ethereum trading within an expansive ascending channel that traces back to 2022. The lower boundary of this channel has consistently provided support during multiple significant pullbacks, with buyers emerging near these levels repeatedly.
The upper channel boundary has likewise been tested during periods of strength, forming a substantial corridor where deep retracements haven’t compromised the overarching bullish structure. This formation remains valid provided the rising support line continues to hold.
Crypto analyst Ali Charts noted on X that assuming ETH operates within this channel framework, $1,551 and $1,070 represent the essential support levels to watch beneath current valuations.
As of April 6, 2026, Ethereum has gained 0.55% and maintains trading activity above $2,080, positioning the $2,150 resistance zone as the next critical challenge for bullish momentum.
Get 3 Free Stock Ebooks
Discover top-performing stocks in AI, Crypto, and Technology with expert analysis.
- Top 10 AI Stocks - Leading AI companies
- Top 10 Crypto Stocks - Blockchain leaders
- Top 10 Tech Stocks - Tech giants


