

Key Highlights
- Binance Coin declined more than 5% in 24 hours, breaking through the critical $600 threshold
- Crude oil prices climbed beyond $110 per barrel following escalating Middle Eastern geopolitical conflicts
- Technical indicators show three successive bearish signals on the 4-hour timeframe pointing to institutional distribution
- Further downside toward $520 remains likely if selling pressure intensifies
- Daily RSI indicator dropped beneath 40, reinforcing negative momentum
Binance Coin has experienced a sharp decline of over 5% during the latest trading session, falling beneath the psychologically significant $600 mark that market participants had been monitoring. The digital asset momentarily dipped to $580 before stabilizing at current support.
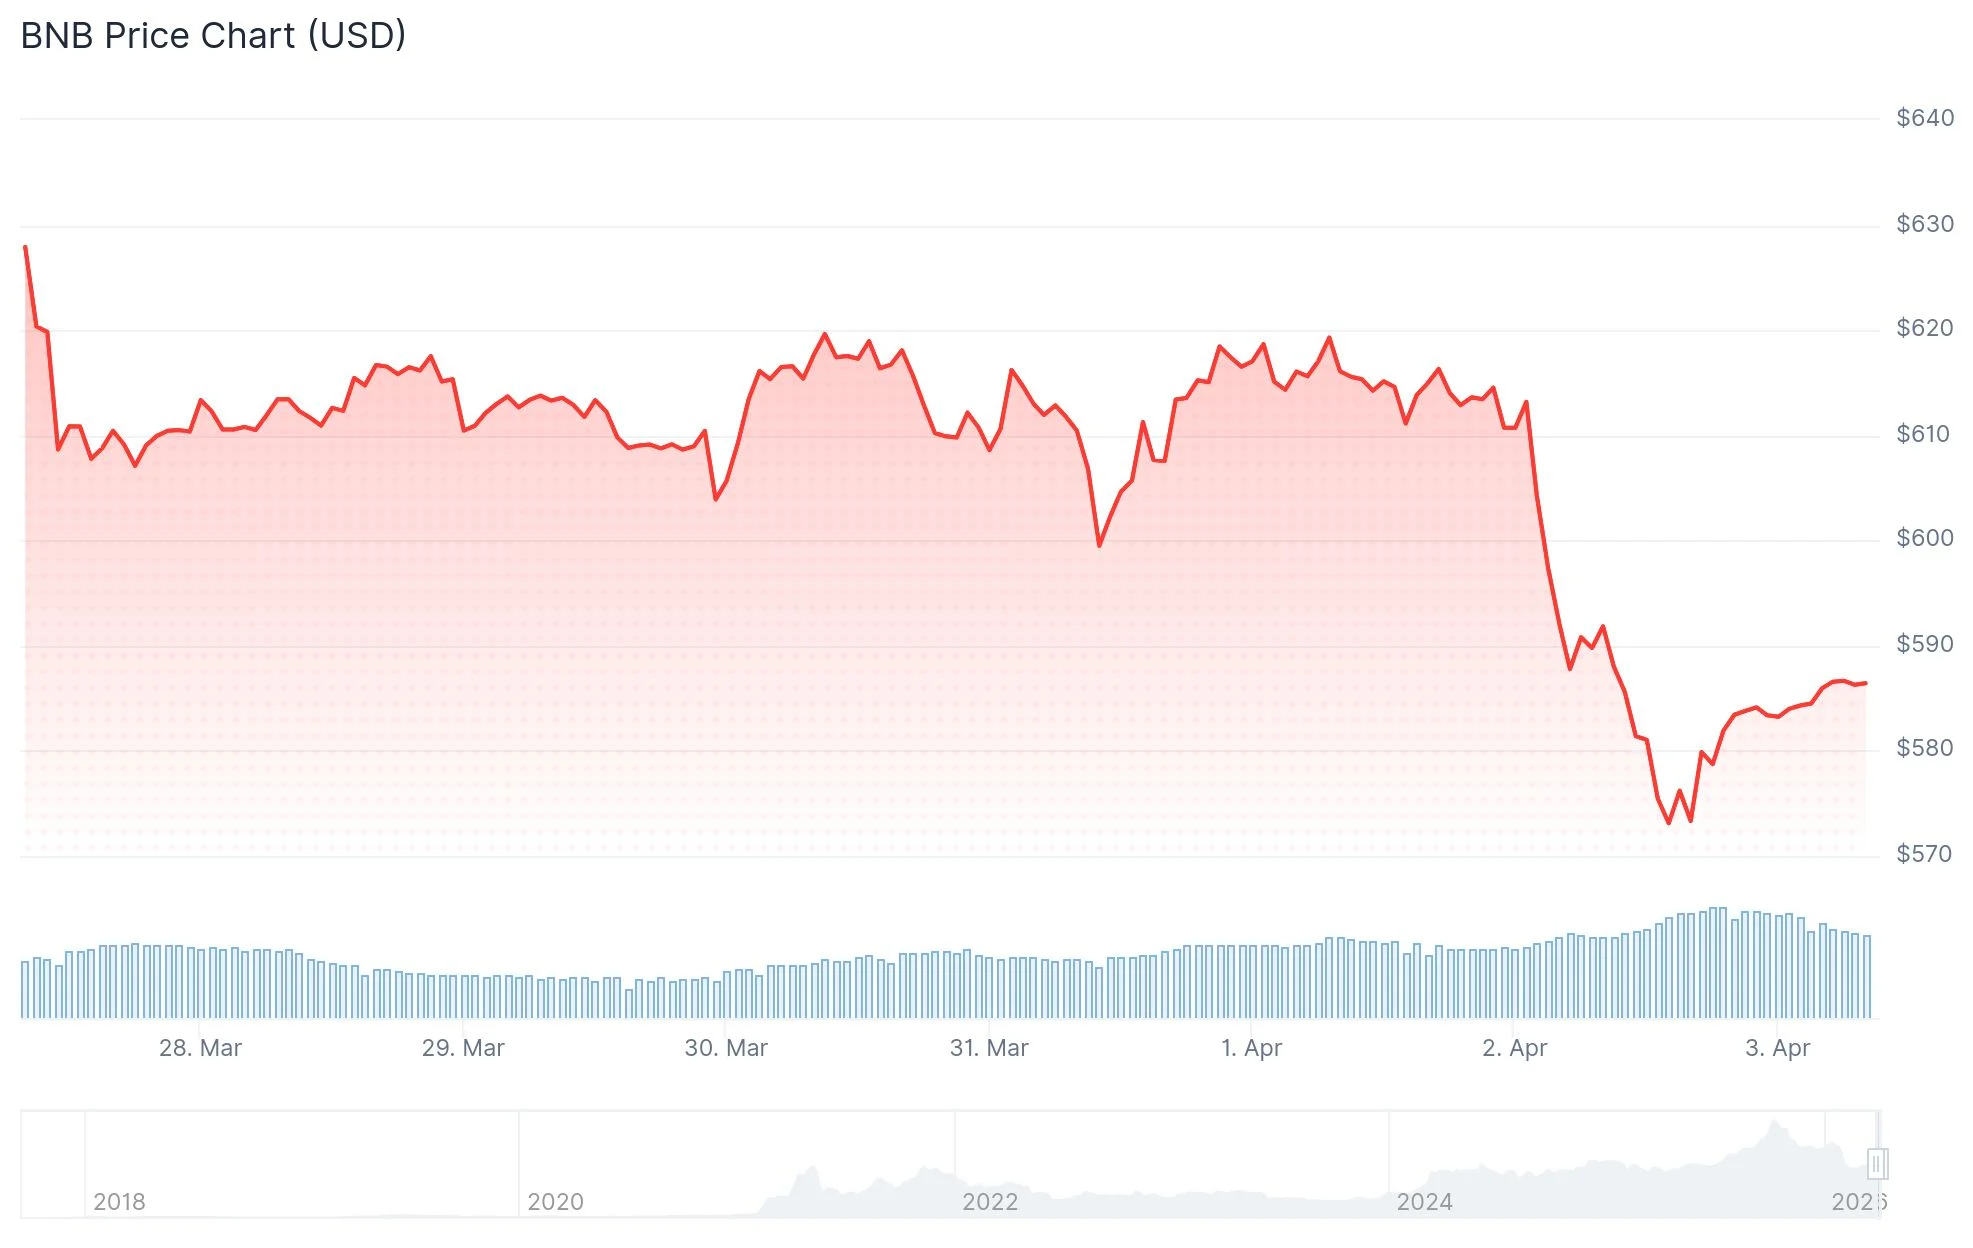
The rapid selloff coincides with crude oil’s surge past $110 per barrel. Heightened tensions emerged after President Trump issued military threats against Iran regarding Strait of Hormuz shipping access, creating widespread market anxiety and prompting capital flight from higher-risk assets including cryptocurrencies.
BNB’s trading volume surged by 35% over the past day as the token approached and tested the $580 demand level.
Currently priced at $580, Binance Coin now trades 57% beneath its previous peak of $1,360. This substantial distance from all-time highs illustrates the magnitude of bearish sentiment that has accumulated in recent months.
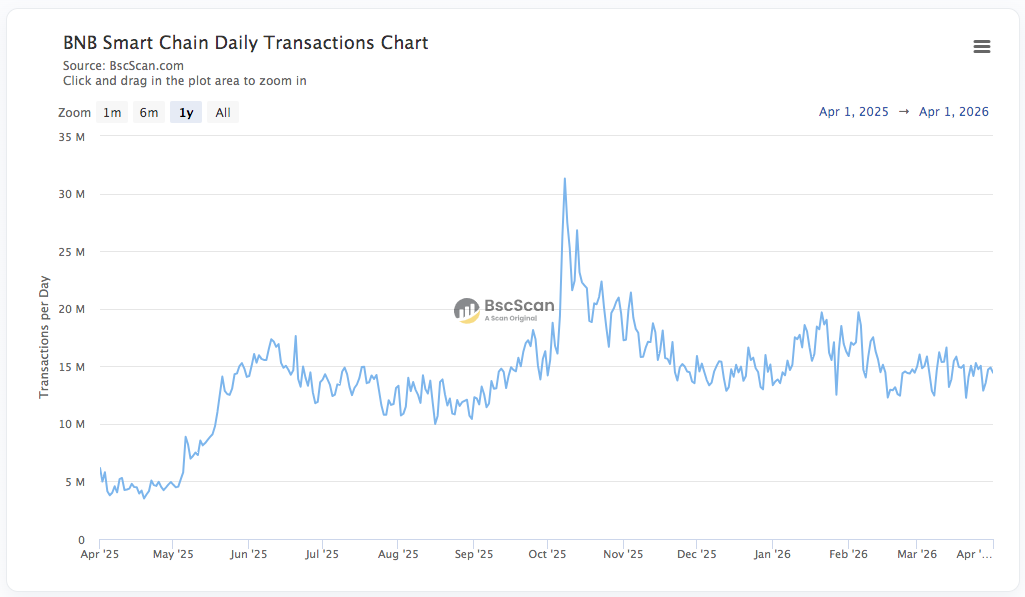
Binance Coin serves two primary functions: providing trading fee reductions on the Binance exchange and facilitating transaction fees across BNB Chain. Blockchain analytics from BSC Scan indicate daily transaction counts ranging from 13 to 19 million, remaining consistent with historical averages.

Bearish Momentum Dominates
Daily price action reveals BNB has revisited the $580 support level three times within the past two months. This repeated testing of the same price floor typically undermines bullish scenarios for the immediate future.
The Relative Strength Index on the daily timeframe has declined below 40, a threshold that technical analysts interpret as confirming bearish conditions.
Macroeconomic headwinds continue mounting. The Federal Reserve’s monetary policy outlook has shifted, with market participants no longer anticipating rate reductions in 2026. Just one month ago, approximately 47% of analysts projected a June rate cut.
Multiple Bearish Signals Emerge
Examining the 4-hour chart reveals three consecutive bearish signals materializing since March 18. The latest signal formed following the conclusion of U.S. market hours on April 2.
These recurring signals suggest coordinated selling activity potentially involving institutional traders. The 4-hour RSI has entered oversold conditions, which may trigger a temporary relief bounce.
Should this rebound materialize, it could present an opportunity for short positions before a possible continuation toward the $520 level.
Crypto analyst Patel shared on X that BNB breached $570 for the first time in more than twelve months. The analyst highlighted the $400–$500 range as a strategic accumulation zone based on Fibonacci retracement levels of 0.5 and 0.618, referencing historical price patterns.
Binance Coin currently competes closely with XRP and USDC for the fifth position by total market capitalization, trailing XRP by approximately $1 billion.
The Fear & Greed Index currently registers at 9, indicating extreme fear sentiment dominating cryptocurrency markets broadly.
Get 3 Free Stock Ebooks
Discover top-performing stocks in AI, Crypto, and Technology with expert analysis.
- Top 10 AI Stocks - Leading AI companies
- Top 10 Crypto Stocks - Blockchain leaders
- Top 10 Tech Stocks - Tech giants


