
 Faces Downward Pressure Despite Major Whale Accumulation Activity")
Key Takeaways
- Cardano hovers near $0.24 following a 14-day downward trend
- Large holders absorbed 230 million ADA during a five-day window ending Monday
- Derivatives traders favor long positions with a ratio of 1.14
- Technical indicators show weakness with RSI at 41 and price trading beneath major moving averages
- Crypto analyst Ali Charts identified a channel breakdown targeting the $0.22 level
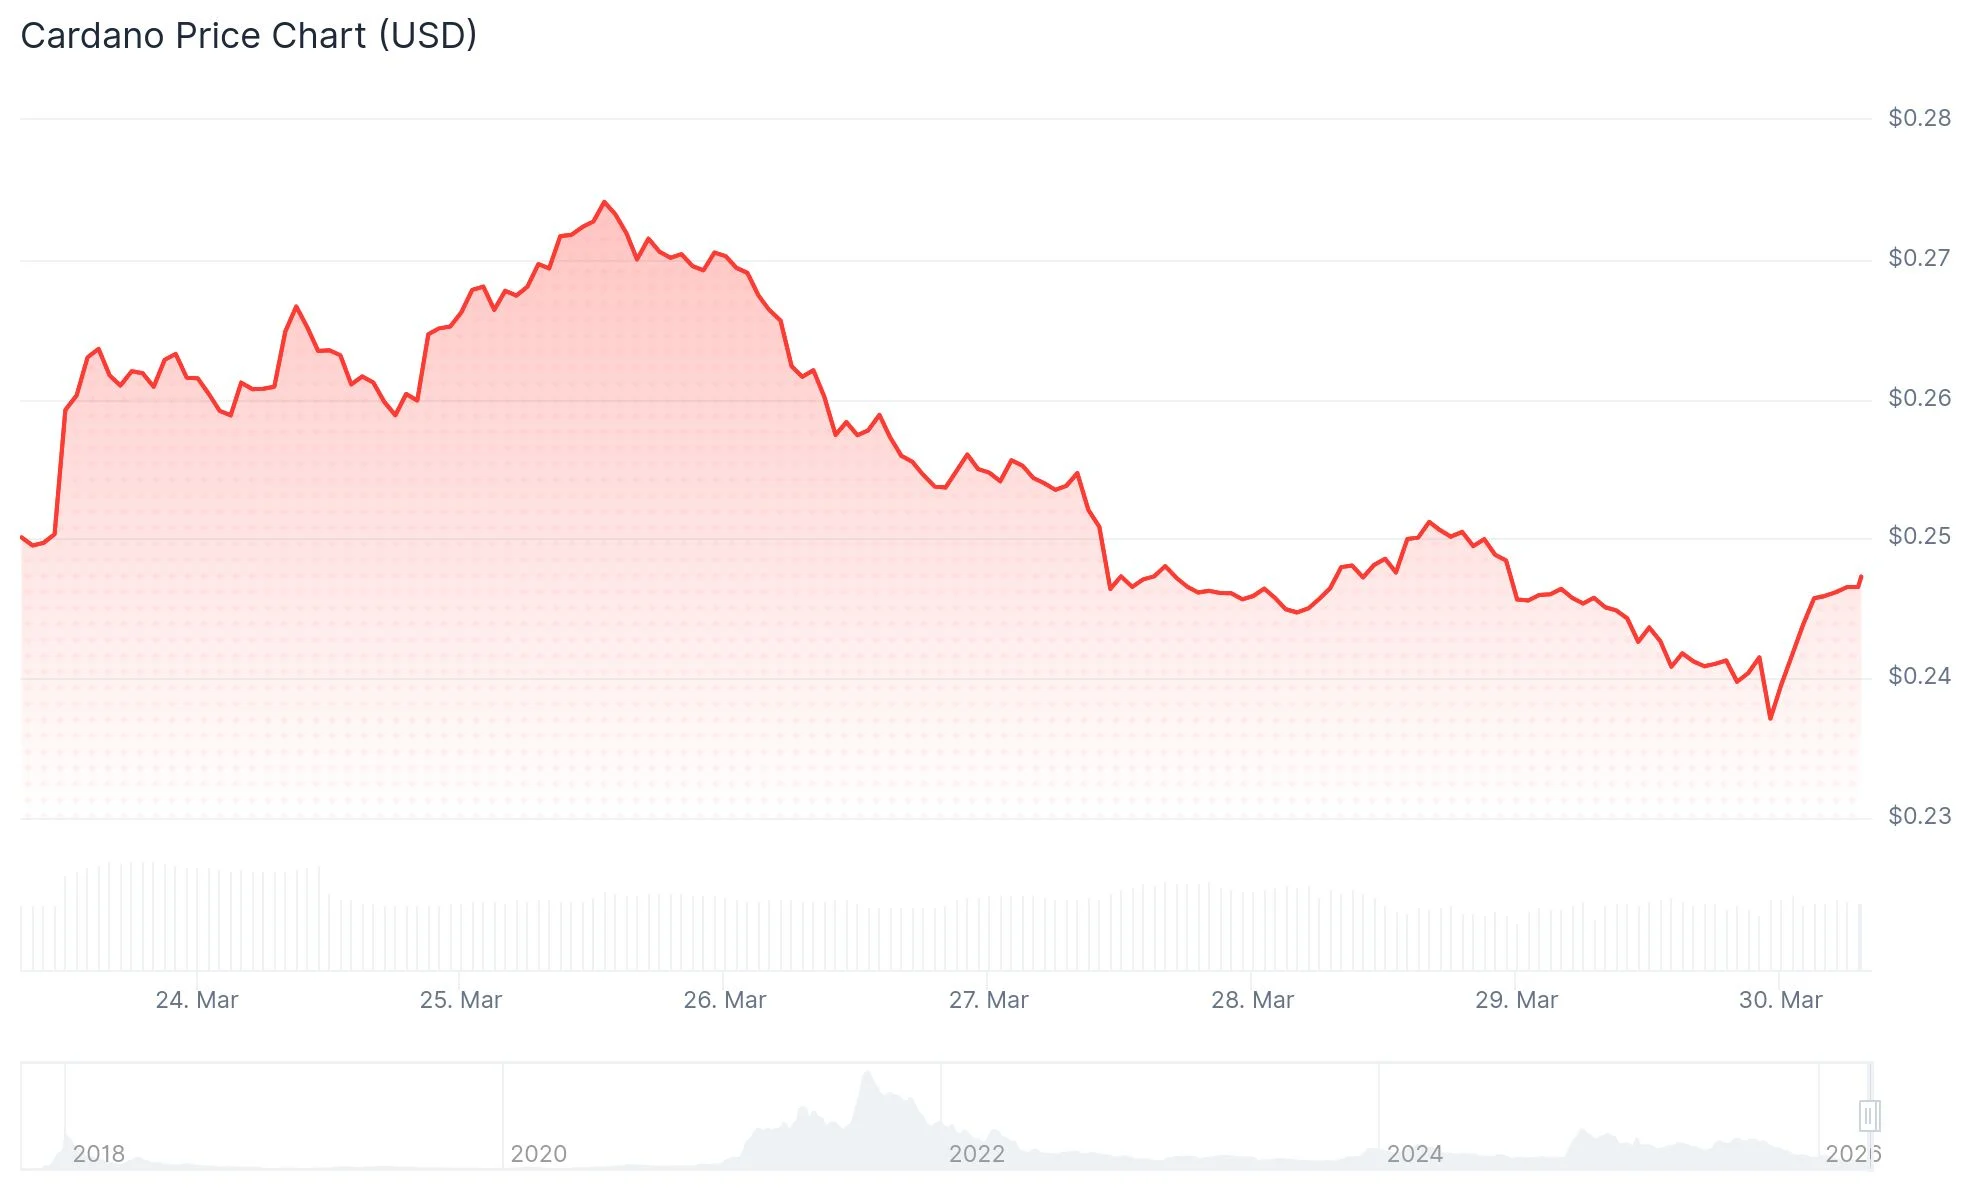
Cardano (ADA) continues to hover around the $0.24 mark as Monday’s session unfolds, managing a modest rebound from a fortnight of declining prices. Weekly performance remains negative at over 4%, while technical momentum indicators maintain their bearish posture.
Despite lackluster price performance, blockchain data reveals significant accumulation activity among major token holders. Santiment’s tracking shows that two distinct whale categories—addresses holding 100,000 to 1 million ADA and those controlling 10 million to 100 million ADA—collectively acquired 230 million tokens during the Wednesday through Monday timeframe.
%20%5B08-1774842903642-1774842903642.18.27%2C%2030%20Mar%2C%202026%5D.png&w=1536&q=95)
The accumulation picture isn’t uniform across all holder tiers, though. Wallets containing 1 million to 10 million ADA reduced their positions by approximately 30 million tokens during the identical window, suggesting selective distribution among mid-tier whales.
Derivatives market data from CoinGlass indicates ADA’s long-to-short positioning ratio stands at 1.14, approaching its highest reading in more than 30 days. This metric above the 1.0 threshold indicates more market participants are positioned for upward movement than downward.
CryptoQuant’s analysis similarly shows predominantly neutral sentiment with modest bullish undertones, evidenced by substantial whale activity across both spot and futures trading venues.

Chart Analysis Reveals Ongoing Weakness
The optimistic positioning data contrasts sharply with price action and technical formations. ADA currently trades beneath both its 50-day and 100-day exponential moving averages, with both indicators sloping downward.
The Relative Strength Index registers 41, indicating subdued momentum while remaining above oversold thresholds. The MACD configuration has deteriorated, with the MACD line crossing back under both the signal line and zero level, while histogram bars expand on the negative side.
Near-term support emerges at the $0.23 level. Should this floor fail, Cardano could descend toward $0.22. Resistance overhead appears at $0.26, followed by a more significant obstacle near $0.29.
Technical Analyst Identifies Channel Violation
Market analyst Ali Charts shared on X that Cardano has violated its established price channel, creating conditions for a potential decline to the $0.22 region. The observation, posted approximately 12 hours prior, reinforces the bearish technical configuration evident across various analytical frameworks.
Cardano tested support near $0.237 following rejection from the $0.275 area earlier this week. The Chaikin Money Flow metric has plunged significantly into negative readings, indicating capital outflows from the asset.
Persistent testing of the $0.23 to $0.24 support band gradually erodes its strength. Should this critical zone fail to hold, the subsequent meaningful support level resides at $0.20.
Get 3 Free Stock Ebooks
Discover top-performing stocks in AI, Crypto, and Technology with expert analysis.
- Top 10 AI Stocks - Leading AI companies
- Top 10 Crypto Stocks - Blockchain leaders
- Top 10 Tech Stocks - Tech giants


