
 Eyes 30% Surge as Critical $90 Support Level Faces Ultimate Test")
Key Takeaways
- Solana is currently trading in the $89–$90 range, with buyers actively defending this crucial support zone.
- Successfully breaking above $90 could open the door to $120, representing approximately 30% upside potential.
- Market participants witnessed a 30% surge in trading volumes throughout the past month, with levels temporarily touching $5 billion.
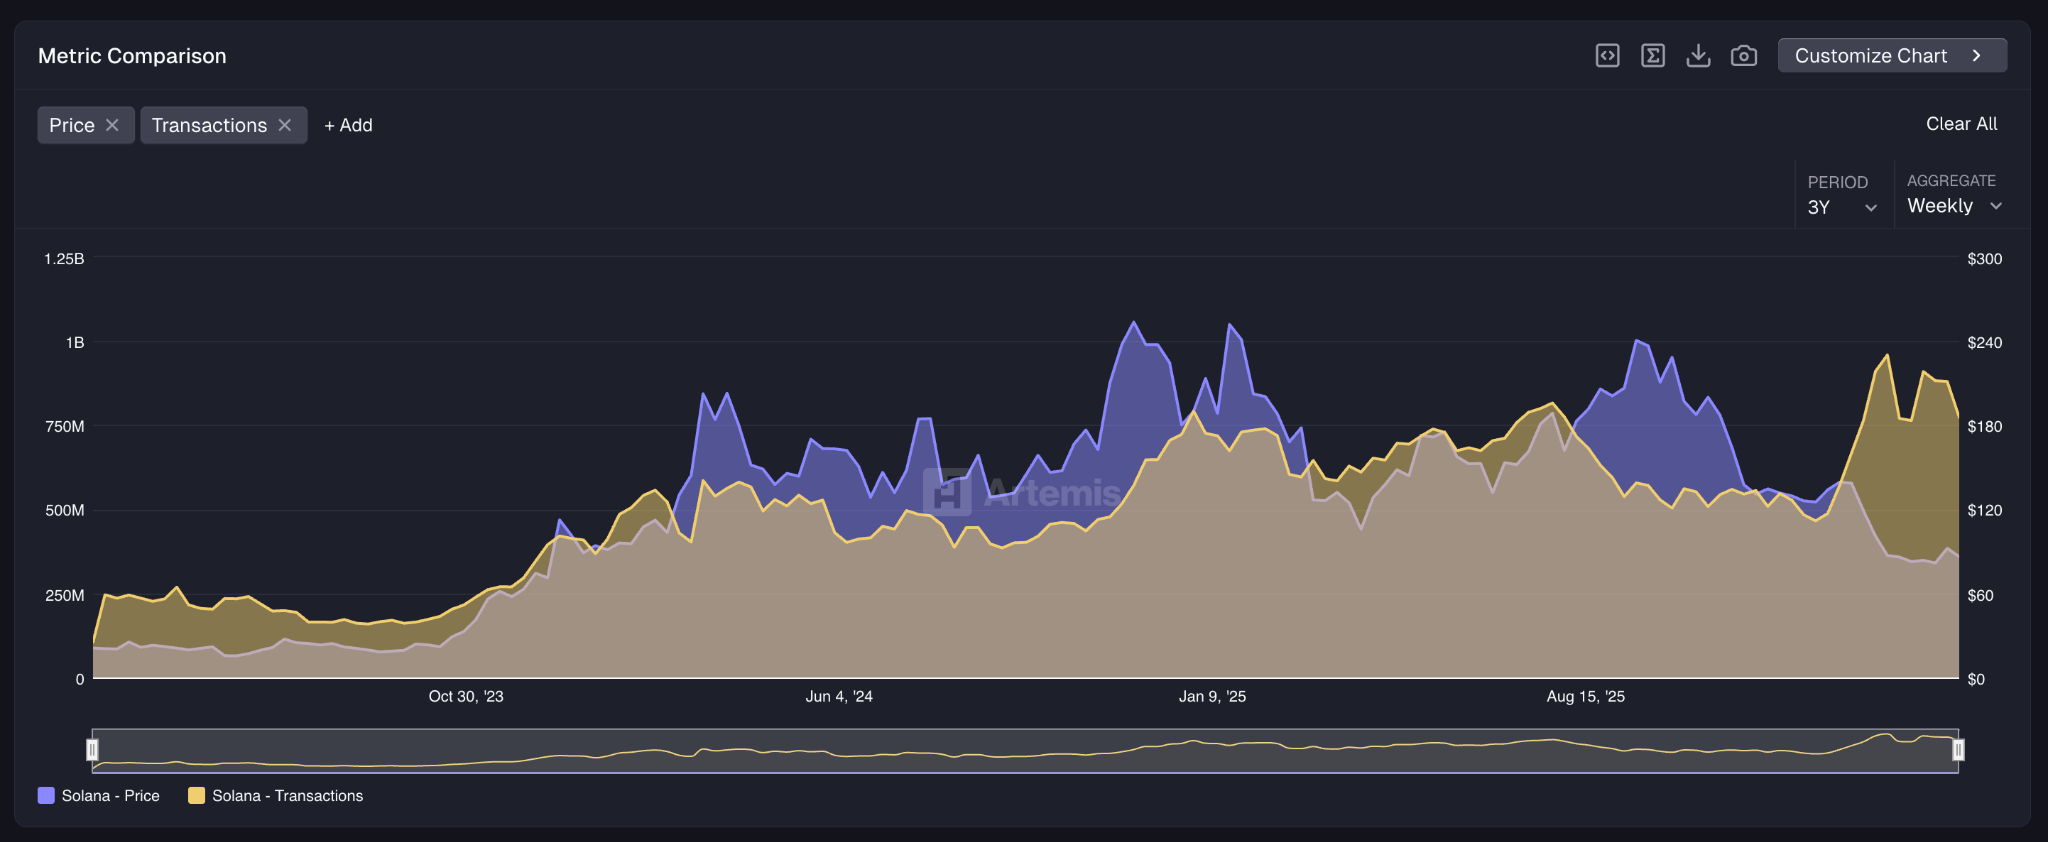
- Network activity has cooled off, with on-chain transactions declining roughly 20% from their recent high point.
- Market analyst Crypto Patel highlights a monthly bullish engulfing pattern as the critical indicator that could signal a substantial price surge.
Solana continues to trade around the $90 threshold as market forces battle for control of this pivotal price point. The next several sessions will likely determine whether SOL can mount a sustained advance or retreat to lower support zones.
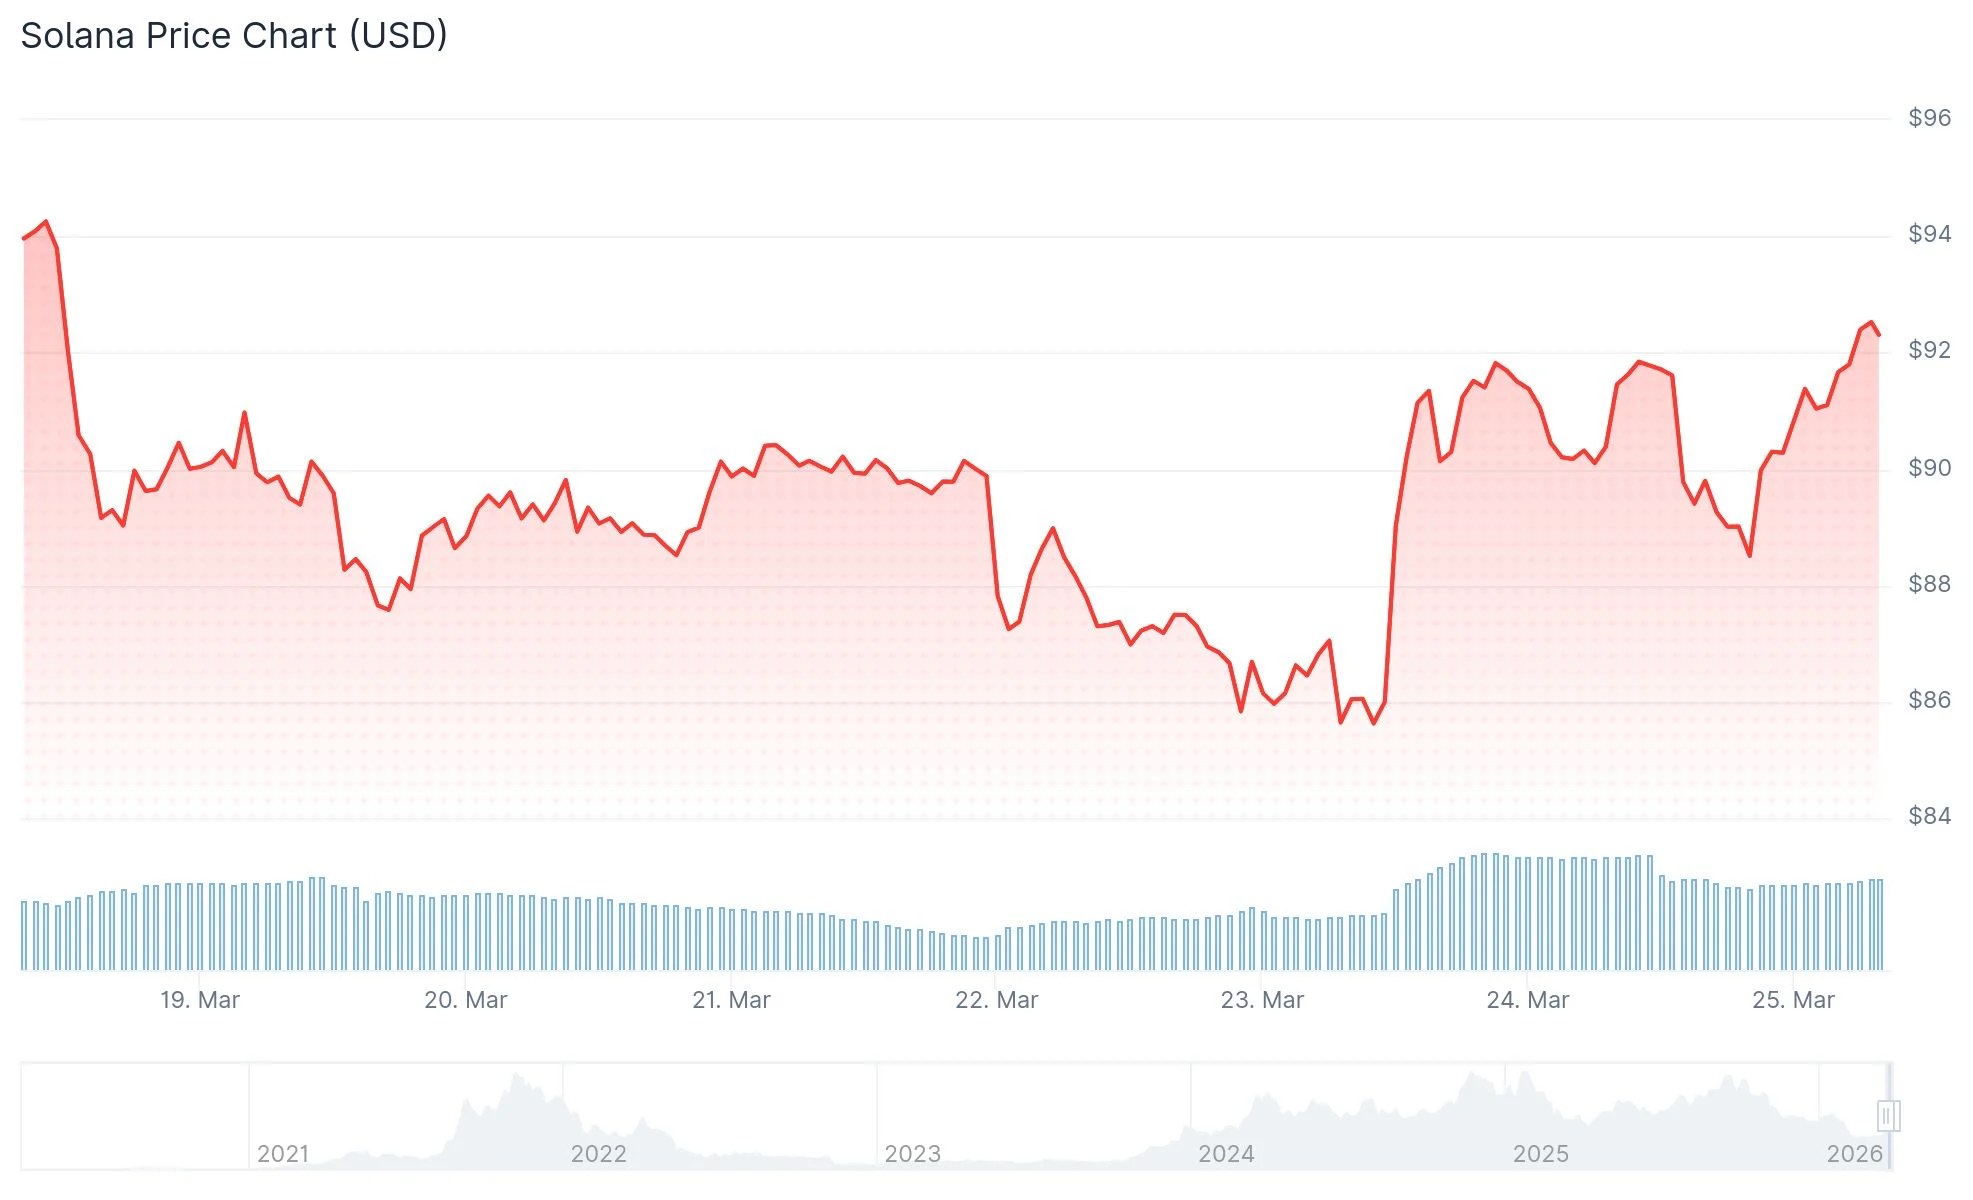
Over the last 30 days, SOL has posted gains of approximately 7%, maintaining its position just beneath the $90 resistance barrier. Volume metrics reveal a 30% increase during this timeframe, with activity levels approaching the $5 billion threshold—representing roughly 10% of the token’s actively circulating market capitalization.
Broader cryptocurrency markets received a boost earlier this week following President Donald Trump’s announcement to temporarily halt U.S. military operations targeting Iranian energy infrastructure. This development momentarily propelled SOL beyond the $90 mark, though sellers quickly emerged to cap further gains.
Liquidation records indicate that more than $370 million in bearish positions were eliminated during that upward spike. Should buying momentum intensify, conditions could be ripe for an even more substantial short squeeze event.
Technical analysis of the daily timeframe reveals the Relative Strength Index (RSI) currently positioned at 54, after touching above 60 in the previous week. This reading indicates strengthening momentum that has yet to fully materialize into a confirmed breakout.

Critical Price Thresholds Under Scrutiny
A decisive move above $90 would likely target the $100 level next, marking an 11% advance. Continued strength beyond that psychological barrier could propel prices toward $120, delivering a substantial 30% return from present valuations.
Examining the 4-hour timeframe, a buy signal triggered precisely as SOL tested the $90 level, indicating that larger market participants are actively accumulating at this price point. This activity reinforces the technical significance of the $90 zone.
Conversely, if bearish forces gain the upper hand, SOL may retreat to the $85 support level, with $80 serving as the next line of defense. The intensity of any downward pressure would dictate how deep a potential correction might extend.
Blockchain Metrics and Long-Term Technical Patterns
Blockchain analytics platform Artemis reports that Solana processed 774 million transactions during the previous week. This figure represents a 20% decrease from the network’s recent peak activity, suggesting a temporary slowdown in user engagement.
Market sentiment, as measured by the Fear and Greed Index, has rebounded from an extreme reading of 5 to reach 46, indicating that investors are gradually emerging from panic territory, though overall sentiment remains neutral to cautious.
Zooming out to the monthly timeframe, market strategist Crypto Patel has identified a compelling historical pattern. His research demonstrates that each significant SOL bull run has been preceded by a monthly bullish engulfing candlestick formation.
Historical precedents are striking: Solana surged from $1.03 to $260 during 2020, and subsequently rocketed from $8 to $296 throughout 2022. According to Patel’s analysis, a comparable candle formation in 2026 could potentially drive SOL toward the $1,000 milestone or beyond.
Present technical readings paint a nuanced picture. The monthly RSI registers 35.44, while SOL remains positioned below all significant moving averages, including the $104, $111, $152, and $160 levels.
The MACD indicator shows a reading of -1.26, positioned beneath its signal line at -20.88, accompanied by a negative histogram value, pointing to ongoing near-term bearish pressure.
As of the latest market data, SOL is valued at $89.33, supported by a 24-hour trading volume of $6.95 billion and commanding a total market capitalization of $51.64 billion.
Get 3 Free Stock Ebooks
Discover top-performing stocks in AI, Crypto, and Technology with expert analysis.
- Top 10 AI Stocks - Leading AI companies
- Top 10 Crypto Stocks - Blockchain leaders
- Top 10 Tech Stocks - Tech giants


