
 SuperTrend Flips Green: First Bullish Signal Since May 2024")
Key Highlights
- Ethereum surged 9% on Monday but encountered strong resistance at the $2,200 threshold
- The 50-day exponential moving average at $2,200 serves as resistance; the 50-day simple moving average at $2,000 provides support
- Ethereum ETF flows have reversed to negative territory, recording more than $27.5 million in net withdrawals during the week concluding March 20
- Successfully breaching $2,200 could activate a technical price objective of $3,080 derived from a symmetrical triangle formation
- For the first time since May of last year, the SuperTrend indicator has shifted to bullish on the daily timeframe
Ethereum’s latest upward momentum encountered significant resistance at the $2,200 mark on Monday, despite a key technical indicator displaying its first positive signal in approximately ten months.
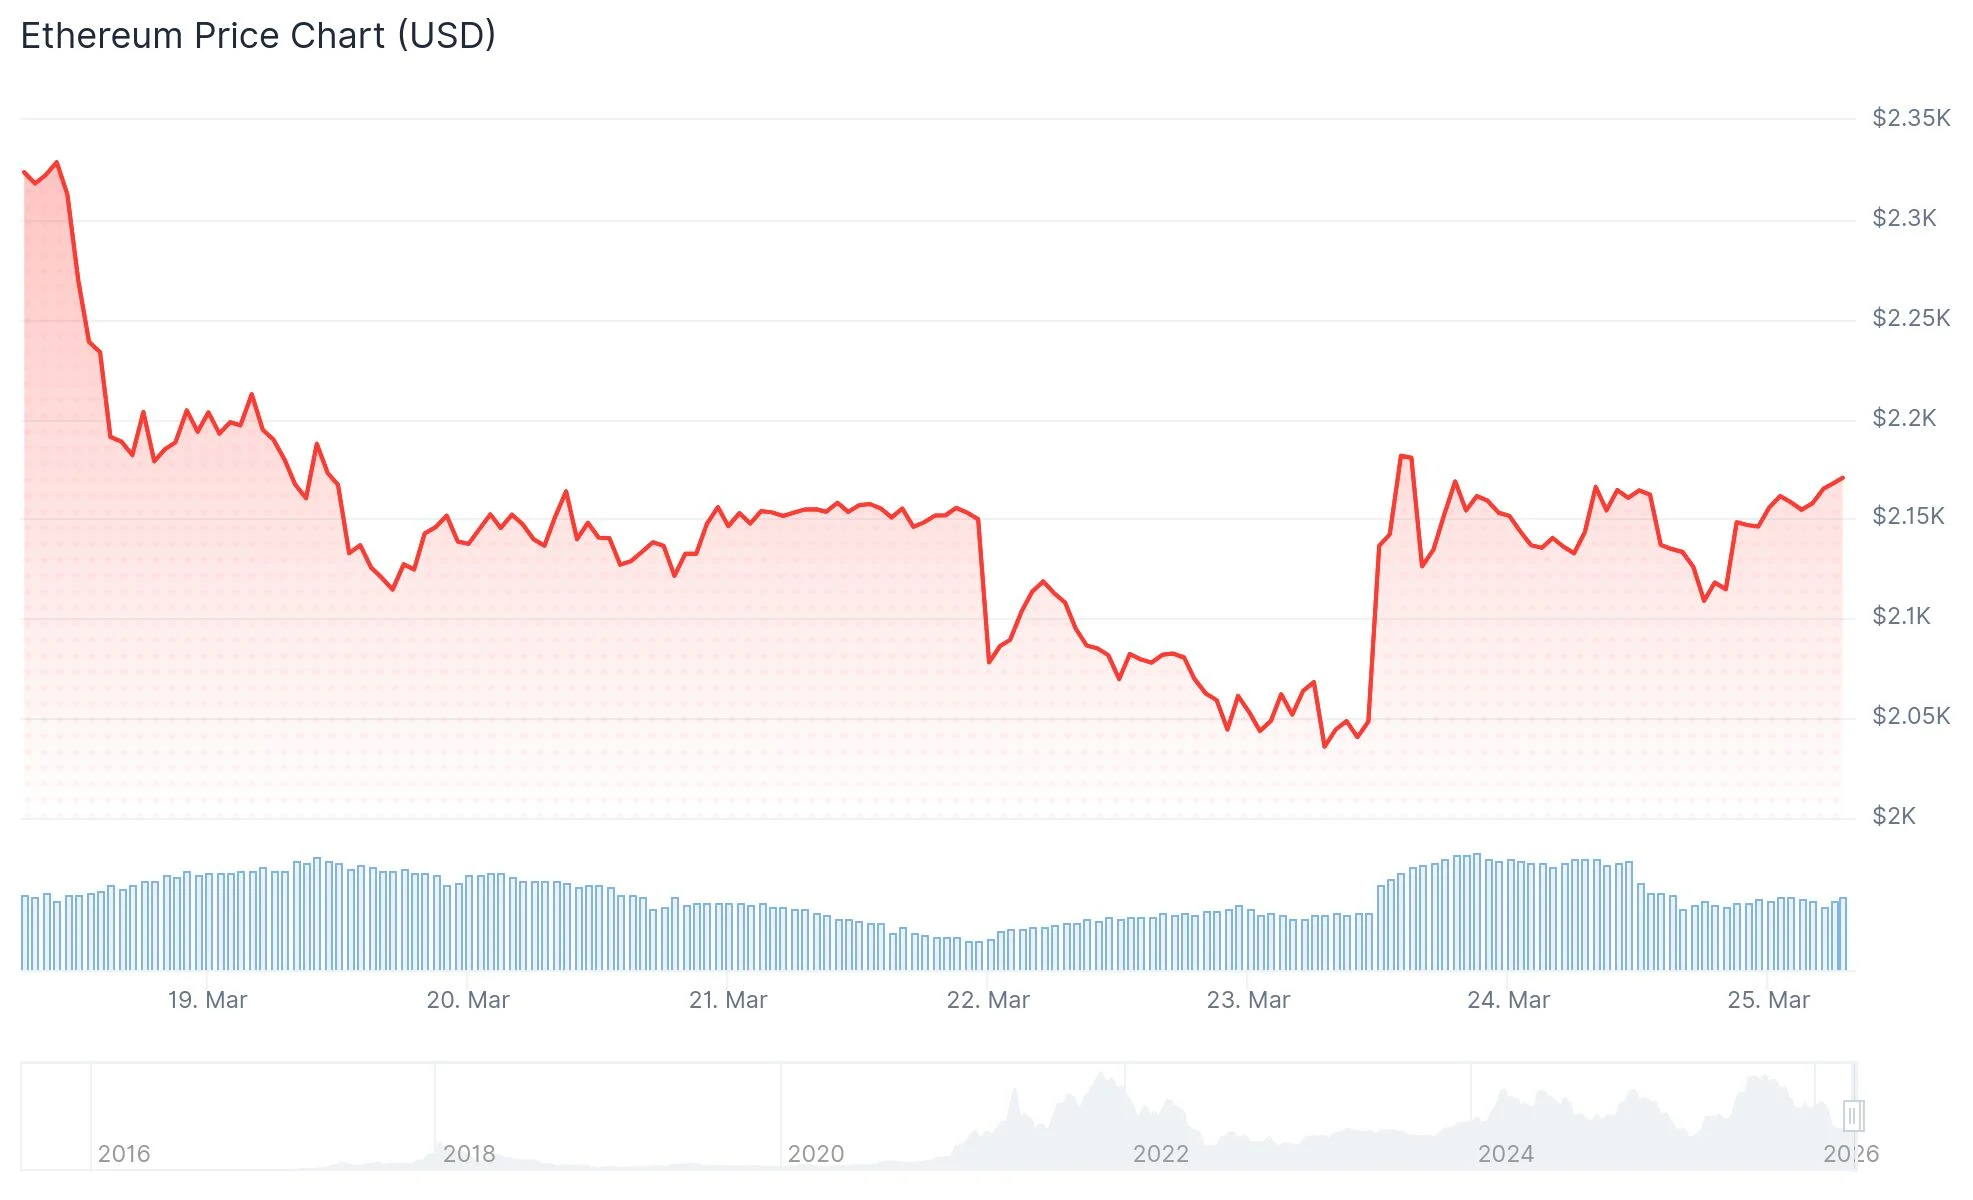
ETH experienced an approximately 9% gain on Monday but failed to sustain movement beyond the $2,200 threshold. This price point aligns precisely with the 50-day exponential moving average (EMA), creating a significant overhead barrier.
The cryptocurrency is presently exchanging hands above $2,120 and maintaining position above the 100-hour simple moving average. Additionally, price action has successfully penetrated a short-duration bearish trend line that was previously established at $2,145 on the hourly timeframe.
Critical Support and Resistance Zones
The next resistance barriers stand at $2,180, followed by $2,200. Beyond these levels, bulls would need to overcome $2,250, $2,300, and $2,345 to maintain upward trajectory.
Should ETH achieve a decisive daily close above $2,200, the symmetrical triangle configuration visible on the daily chart suggests a calculated upside target of $3,080, representing approximately a 42% advance from present price levels.

Nevertheless, before approaching that objective, buyers would encounter formidable resistance within the $2,780 to $2,880 corridor. This zone represents a confluence of the 200-day EMA, 50-week EMA, and 100-week EMA. According to Glassnode analytics, investors accumulated over 7.5 million ETH within the $2,750–$2,850 price range.
Regarding downside risk, should the $2,000 level fail to provide adequate support, analyst Ted Pillows highlighted in an X platform post: “Now, the only crucial support level for Ethereum is $2,000 and if ETH loses it, the dump will accelerate to new lows.” The bearish triangle projection indicates a potential decline to $1,400.
Institutional Demand Remains Weak
A significant challenge currently facing ETH involves diminishing institutional appetite. Spot Ethereum ETF flows have reverted to negative territory following a short-lived period of accumulation. The rolling 30-day average of United States spot ETH ETF flows has declined back into negative range.
Worldwide Ethereum investment vehicles recorded net withdrawals exceeding $27.5 million during the week that concluded on March 20.
Corporate entities purchasing ETH for treasury reserves have also declined substantially since August 2025. The notable outlier is Bitmine Immersion Technologies, spearheaded by Tom Lee, which acquired $139 million worth of ETH in the previous week. Bitmine’s current holdings stand at 4.66 million ETH, advancing toward its publicly announced objective of securing 5% of the circulating supply.
On a more optimistic note, cryptocurrency analyst Ali Charts shared on X: “Momentum is finally shifting back to the Ethereum $ETH bulls. The SuperTrend on the daily chart has turned green (bullish) for the first time since May last year. This suggests the long period of ‘sideways grind’ is ending, and as long as the $1,800 support holds, a new uptrend could begin.”
Bitmine continues as the sole corporate accumulator actively expanding its ETH holdings, with aggregate reserves now totaling 4.66 million ETH.
Get 3 Free Stock Ebooks
Discover top-performing stocks in AI, Crypto, and Technology with expert analysis.
- Top 10 AI Stocks - Leading AI companies
- Top 10 Crypto Stocks - Blockchain leaders
- Top 10 Tech Stocks - Tech giants


