
 Accumulates $136M in Inflows Despite Bearish Technical Setup")
Key Highlights
- Cryptocurrency investment products attracted $230M in net inflows during the previous week, with Bitcoin capturing $219M
- Solana has maintained its inflow momentum for seven consecutive weeks, accumulating $17M last week for a $136M total
- SOL currently hovers near $91–92, posting a 5.64% gain over 24 hours while slipping 3% across the weekly timeframe
- Technical analysts identify a rising wedge formation on the 3-day timeframe, suggesting heightened correction risk
- Critical price zones: $78 acting as support and $95 as resistance, with potential downside extension toward $65–70
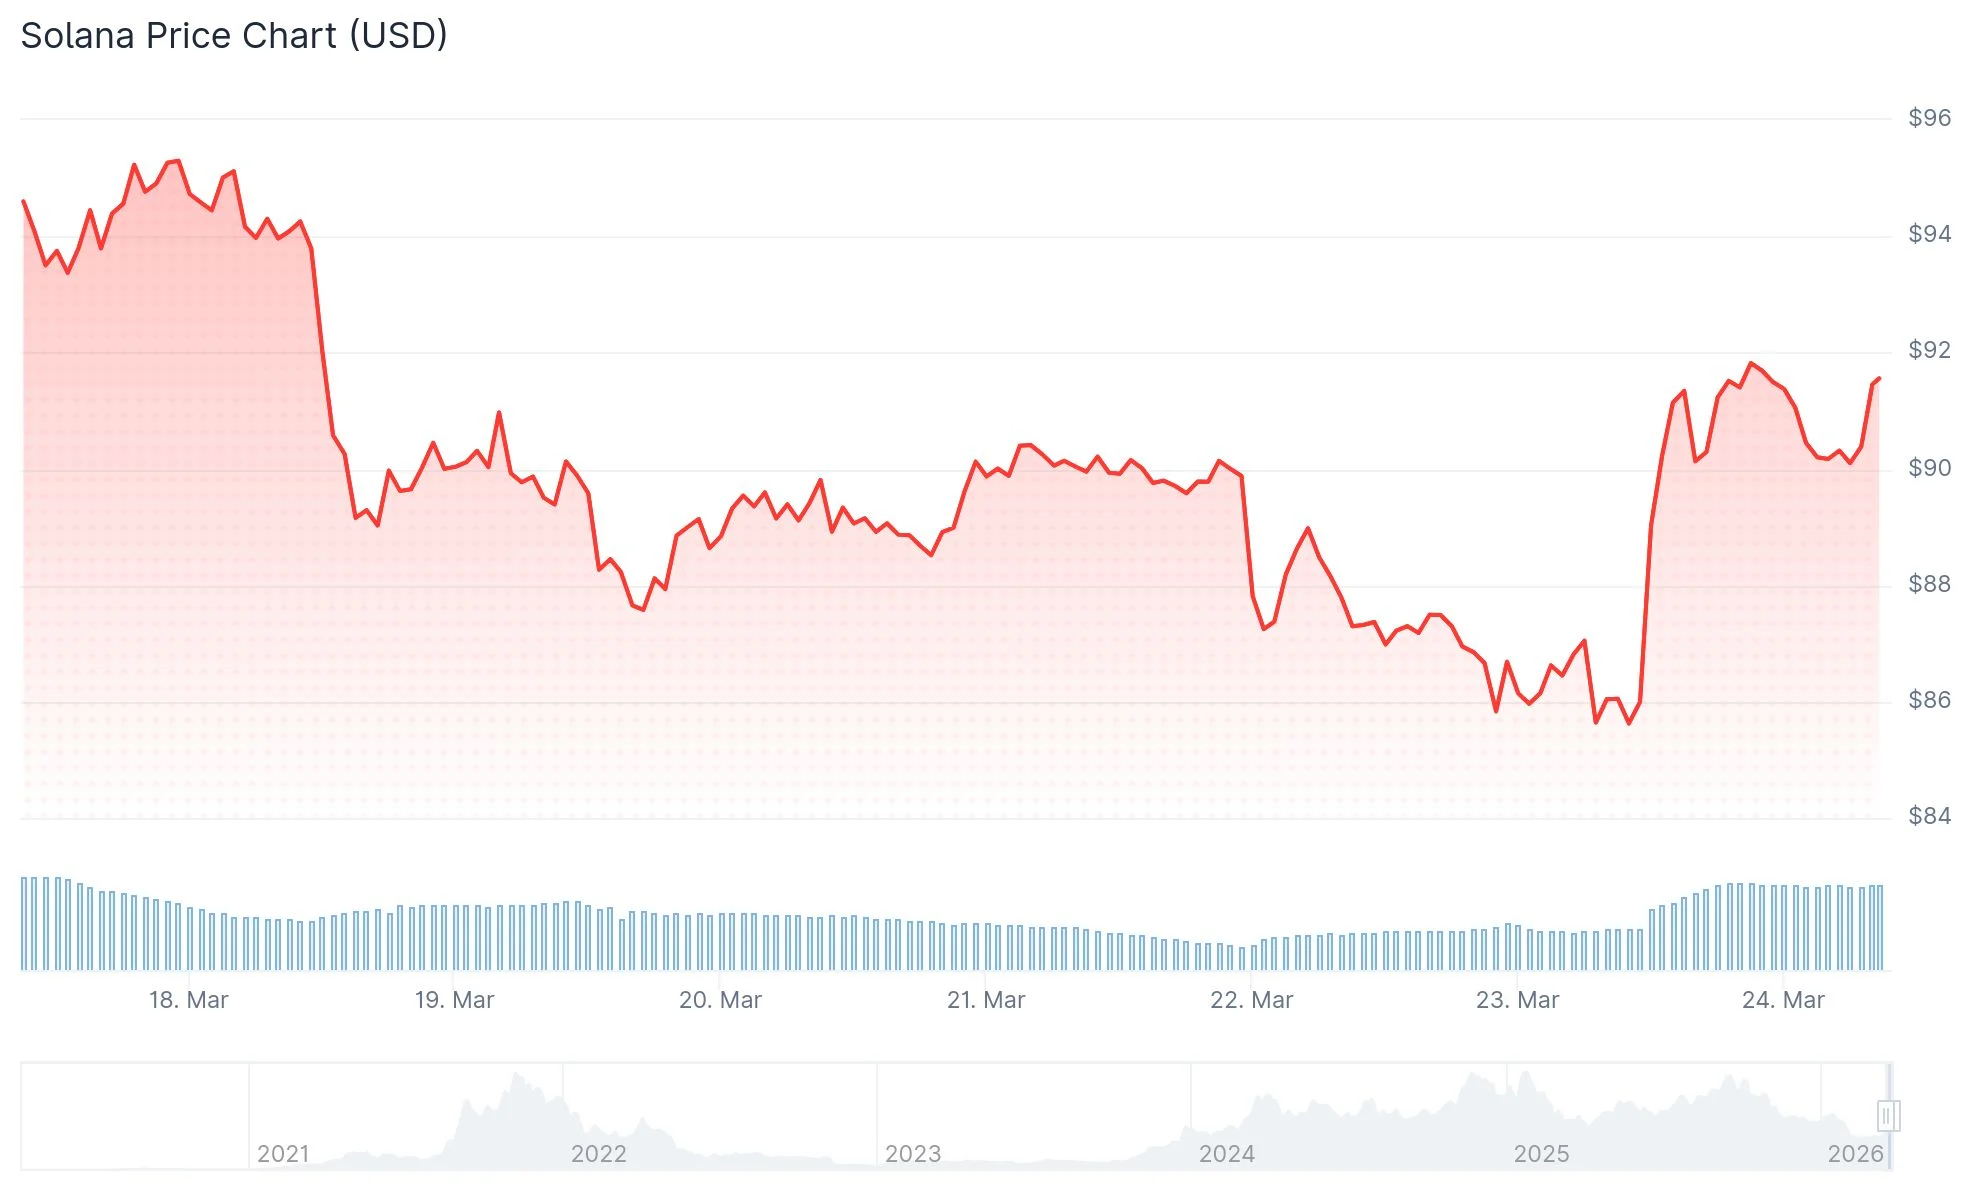
Solana (SOL) has stabilized in the lower $90 range following a short-term bounce, though emerging technical patterns are casting doubt on the sustainability of this recovery attempt.
Cryptocurrency investment vehicles recorded $230M in aggregate inflows throughout the past week, per recent CoinShares reporting. The week began with robust $635M in positive flows, but momentum reversed following the Federal Reserve’s policy announcement, resulting in $405M worth of mid-week withdrawals.
Regional breakdowns show the United States driving inflows with $153M. German investors contributed $30.2M while Swiss allocations reached $27.5M.
Bitcoin dominated capital attraction with $219M in fresh inflows. Ethereum experienced $27.5M in net outflows, ending a three-week positive run.
Solana registered $17M in new allocations last week, marking an unbroken seven-week sequence of positive flows. This extended streak has delivered cumulative inflows totaling $136M.

SOL traded at $91.61 during publication, reflecting a 5.64% climb in the past 24 hours. However, the weekly performance remains negative, showing approximately 3% in losses over the seven-day period.
Rising Wedge Formation Signals Caution
Market analyst CryptoBullet highlighted a developing rising wedge structure on Solana’s 3-day chart. This technical pattern emerged following SOL’s break beneath its 200-week moving average, a widely-monitored indicator for establishing primary trend direction.
Successive rallies within the wedge boundaries have produced diminishing upward movement. This behavior indicates weakening buying pressure and fading bullish conviction. Rising wedges that form during established downtrends frequently precede trend continuation.
Should SOL pierce the lower wedge boundary, accelerated selling pressure may materialize. Market analyst DrBullZeus identifies $78 as the critical support threshold, with breakdown scenarios potentially driving prices toward the $65–70 region.
Weekly Timeframe Presents Conflicting Indicators
Examining the weekly chart reveals that the 100-period and 200-period exponential moving averages maintain upward trajectories, suggesting intact long-term bullish structure. Conversely, the 20-period and 50-period EMAs have begun consolidating horizontally, reflecting momentum deceleration.
Bollinger Bands display pronounced compression, a configuration that historically precedes significant directional movements. The Relative Strength Index registers in the mid-30s range — avoiding oversold conditions while confirming seller dominance.
The MACD indicator persists below the zero line in bearish territory, though declining histogram values suggest potential easing of downward pressure.
Chainlink and Hyperliquid captured secondary attention with $4.6M and $4.5M in respective inflows during the same period.
Regarding upside scenarios, a decisive breach above $95 resistance could propel SOL toward the $110–$120 zone. Extended projections from analyst Moonbag suggest eventual targets near $260–$300, contingent upon SOL reclaiming the $180–$200 range.
The Balance of Power oscillator currently displays negative readings, confirming sellers maintain control based on the most recent data points.
Get 3 Free Stock Ebooks
Discover top-performing stocks in AI, Crypto, and Technology with expert analysis.
- Top 10 AI Stocks - Leading AI companies
- Top 10 Crypto Stocks - Blockchain leaders
- Top 10 Tech Stocks - Tech giants


