
 Price Hovers at Historic Support Zone That Triggered Previous Bull Runs")
Quick Overview
- Cardano is currently trading within the $0.18–$0.25 range, a historically strong support area validated across several cycles.
- Daily chart analysis shows Bollinger Band compression, typically indicating an imminent volatility expansion.
- LayerZero integration now live, enabling Cardano to interact with 160+ blockchain networks and access $90 billion in cross-chain liquidity.
- Price targets being monitored by market watchers include $1, $3, and $10.
- A decisive move above the multi-year descending trendline from 2021 highs would signal potential trend reversal.
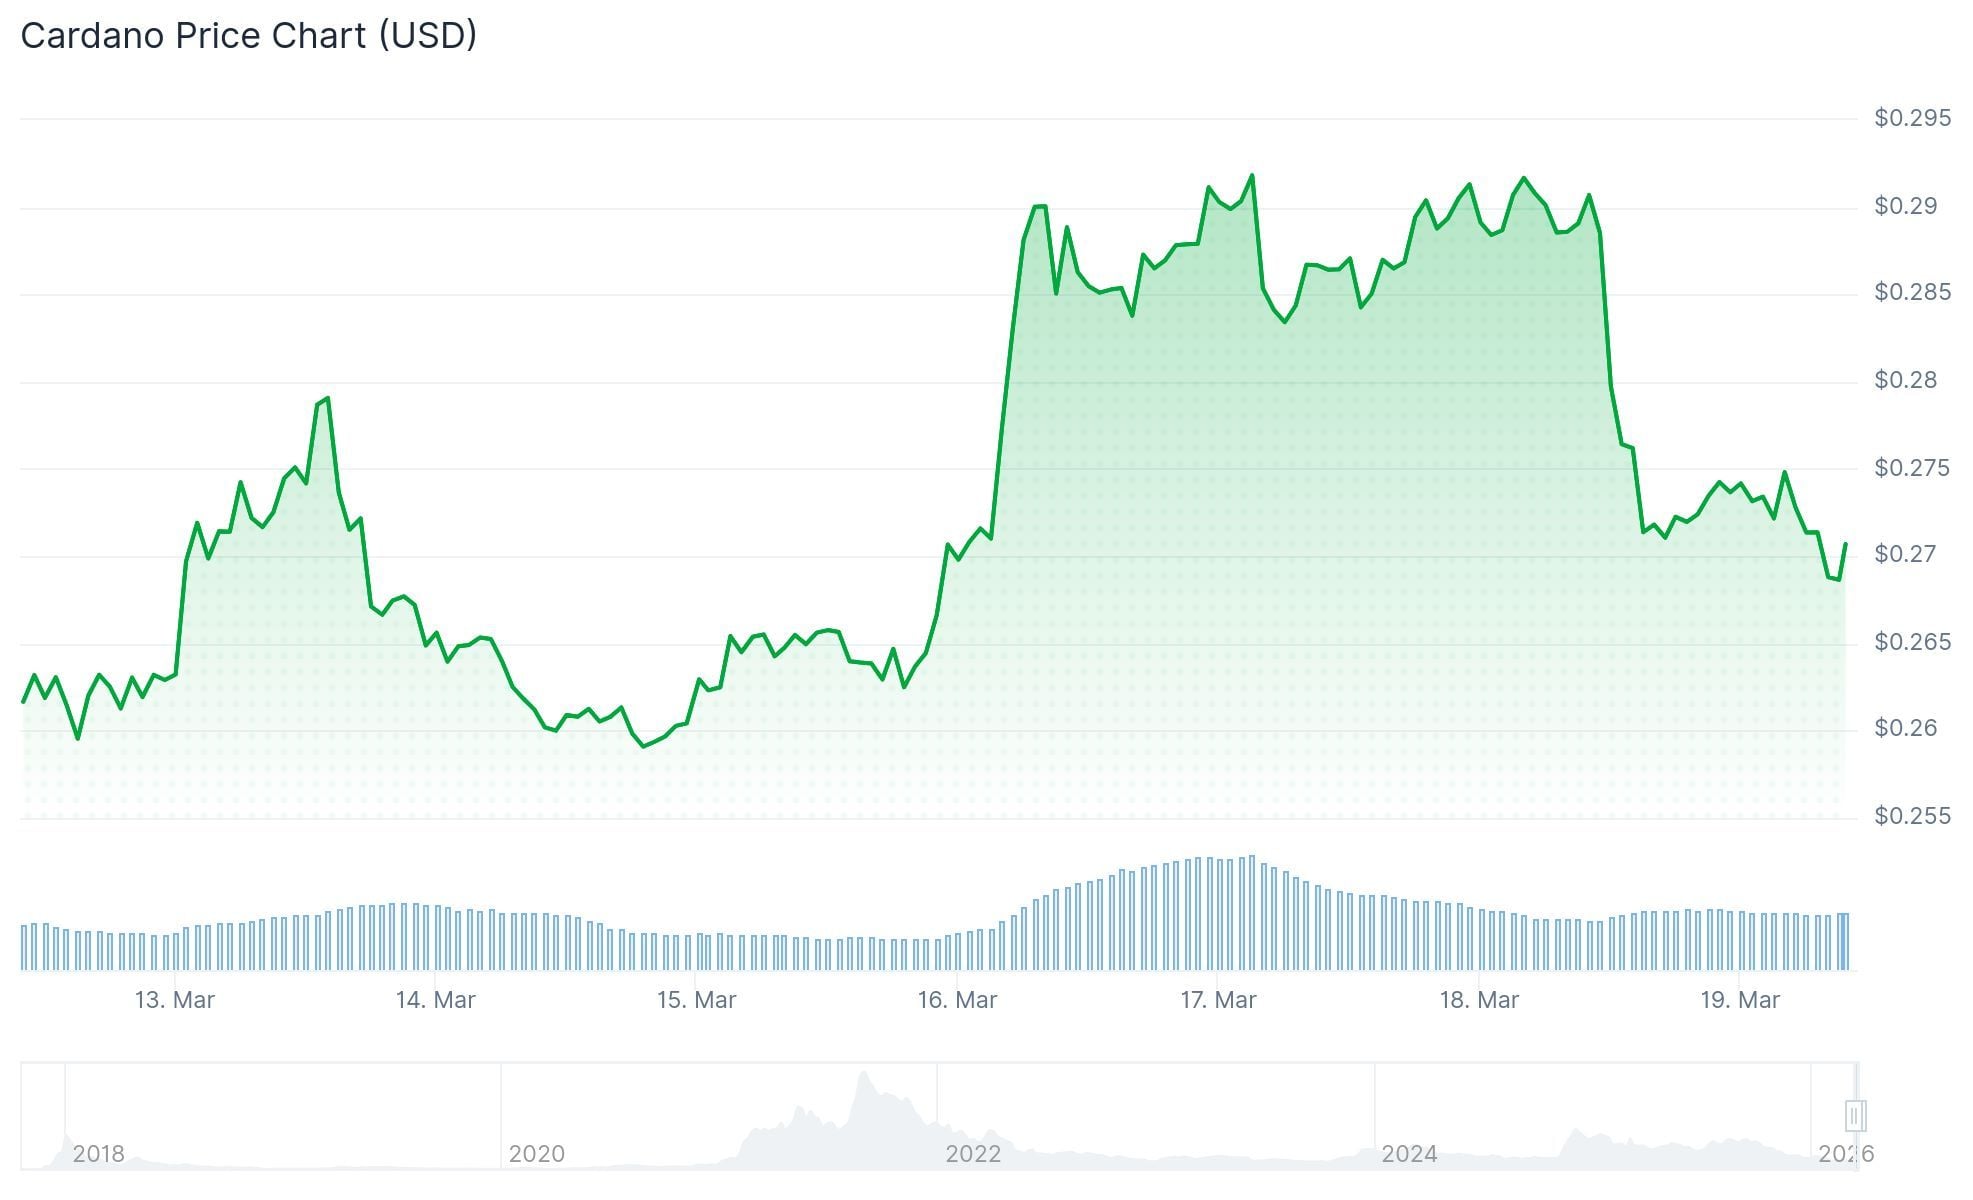
Cardano (ADA) currently changes hands near $0.27, positioned within a historically significant accumulation area that has preceded major upward movements in the past. The token remains approximately 79% below its peak price of $3.10 recorded in 2021.
The $0.18 to $0.25 price corridor has emerged as a reliable support region throughout various market phases. During June 2023, ADA touched $0.22 within this boundary before climbing to $1.32 by the end of 2024.
More recently, in February 2026, the token dipped to $0.2205 before finding support once again in this established zone. Since then, the price has stabilized slightly above this area, entering a consolidation phase.
Market analyst Crypto Patel has highlighted Cardano’s position within this extended accumulation range. He interprets the consistent defense of this price floor as evidence that strategic investors may be establishing long-term holdings.
Chart Analysis and Indicators
Technical indicators reveal Bollinger Bands tightening on Cardano’s chart, a pattern frequently observed before significant directional movement. The token currently trades around its 20-day moving average, indicating neither bulls nor bears have established dominance in the near term.

The MACD indicator displays a subtle bullish signal crossover, though overall momentum remains subdued. Both signal lines continue trading beneath the zero threshold, suggesting buyers haven’t yet secured meaningful control.
A downward-sloping resistance line has remained intact since the 2021 peak. This trendline has rejected multiple rally attempts throughout recent years. ADA now finds itself squeezed between this overhead resistance and the established support floor below.
In mid-March 2026, ADA experienced a 5.56% single-day decline amid selling activity, yet managed to maintain position above the crucial $0.247 support threshold.
Cross-Chain Connectivity Expansion
Cardano finalized its LayerZero integration during March 2026. This technological advancement links the platform to more than 160 separate blockchain ecosystems and unlocks access to over $90 billion in cross-chain digital assets.
The integration eliminates reliance on conventional bridging solutions or centralized intermediaries when transferring value or information across different networks. Analyst Midtern characterized this development as potentially catalyzing increased decentralized finance engagement and developer adoption within the Cardano ecosystem.
Should the support zone prove resilient and ADA successfully breaches the descending resistance boundary, market observers have identified several upside objectives. The initial target sits at $1, representing approximately 270% appreciation from present levels.
Further upside potential includes $3, corresponding with the 2021 record high and implying roughly 1,000% gains. A $5 projection has also been discussed, which would constitute approximately 1,750% growth under extended favorable conditions.
Crypto Patel additionally mentioned that certain analysts have referenced $10 as conceivable during a comprehensive altcoin bull cycle, though this level remains considerably distant from current technical structure.
As of mid-March 2026, ADA maintains its position marginally above the $0.247 support level, with the Bollinger Band compression pattern remaining active.
Get 3 Free Stock Ebooks
Discover top-performing stocks in AI, Crypto, and Technology with expert analysis.
- Top 10 AI Stocks - Leading AI companies
- Top 10 Crypto Stocks - Blockchain leaders
- Top 10 Tech Stocks - Tech giants


