
 Faces 5% Decline Amid Middle East Tensions – Critical Support Zones Ahead")
TLDR
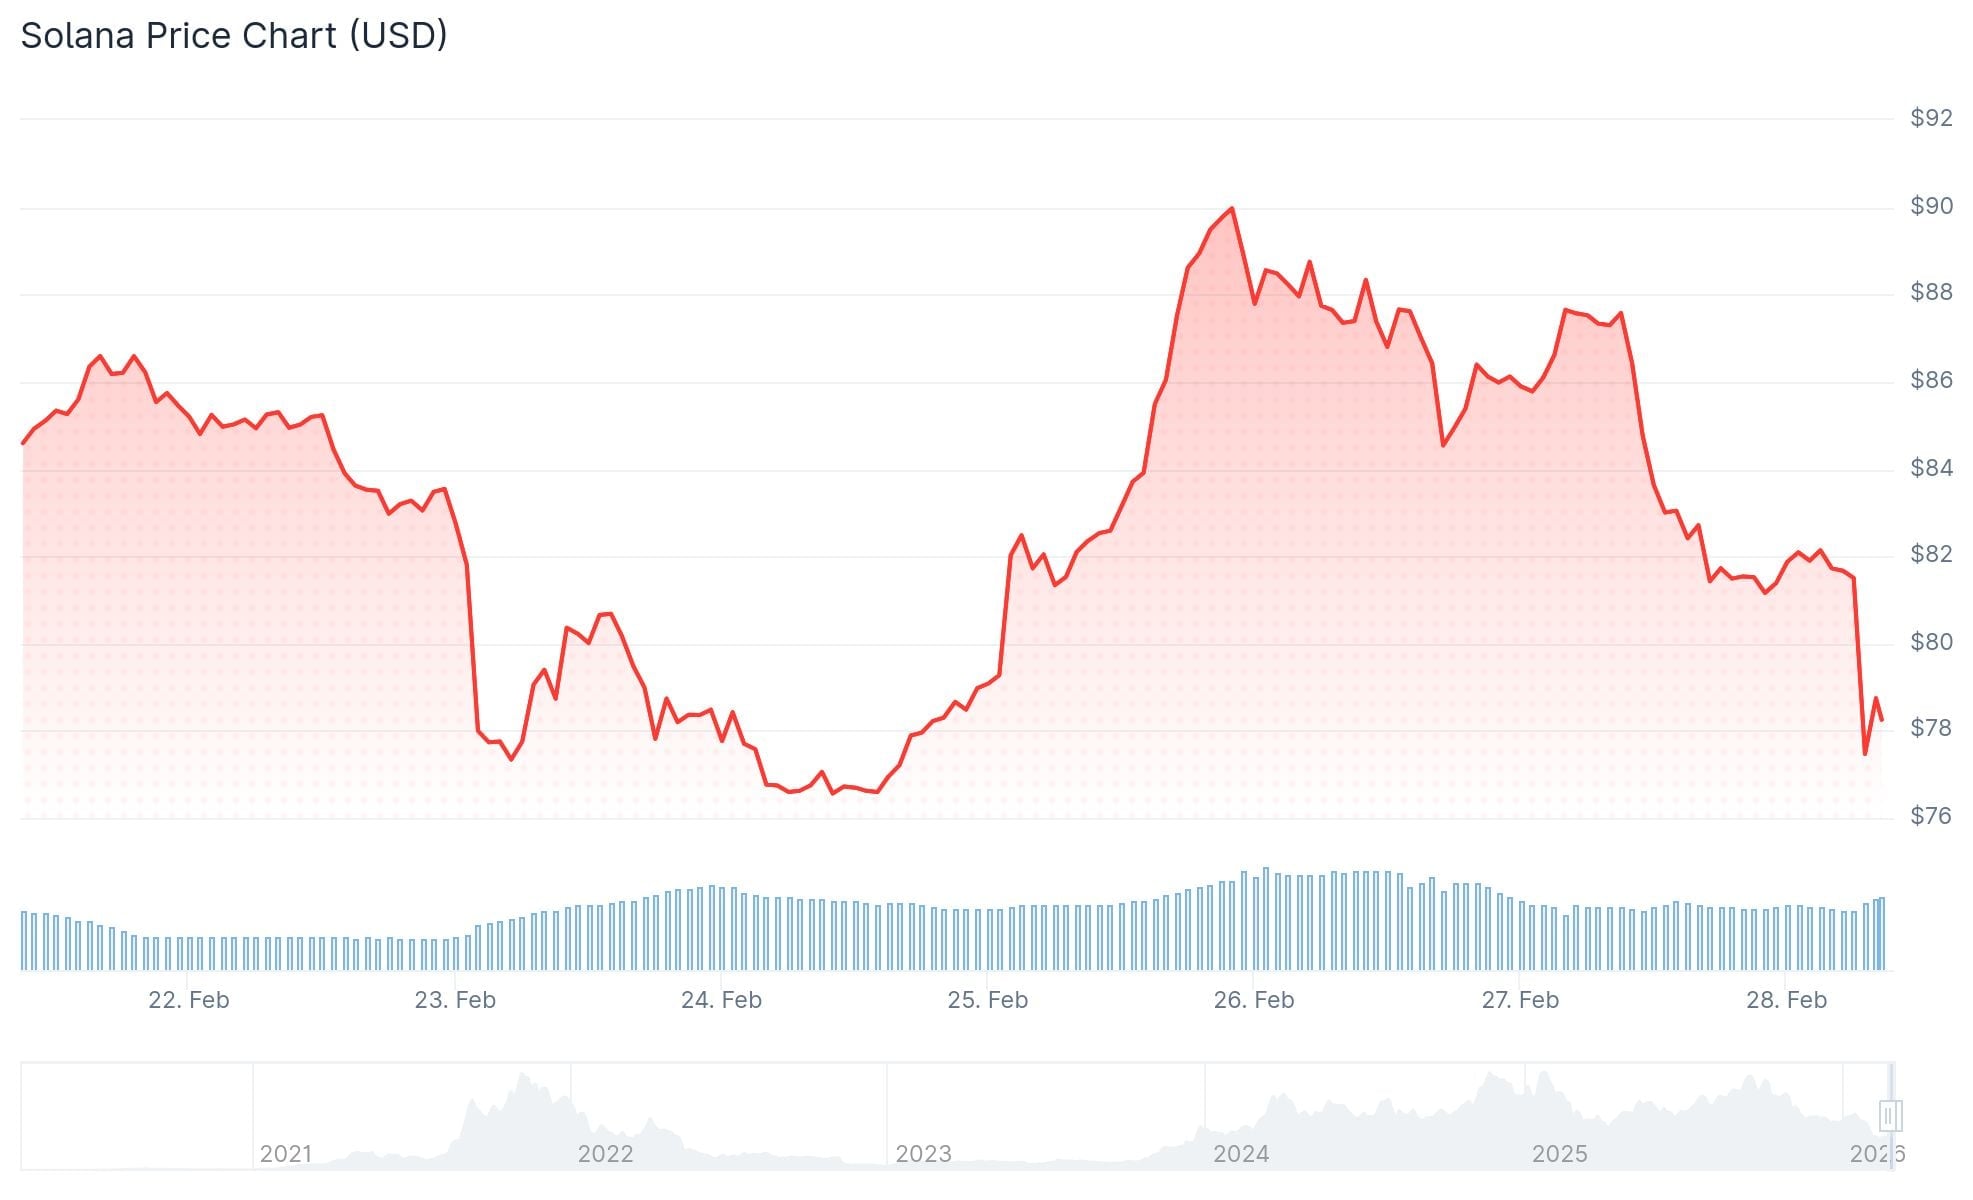
- Solana currently sits 72% beneath its $295 record peak, with prices hovering around the $78 mark
- SOL-based spot ETFs have experienced limited capital outflows totaling $11.3M, contrasting sharply with Bitcoin and Ethereum ETF performance showing four straight months of withdrawals
- Decentralized exchange volume on Solana reached $108 billion over the last 30-day period, surpassing Ethereum’s $63.7 billion
- Technical analysts have pinpointed critical support zones at $50, $22, and $10 using Parallel Channel analysis
- Military operations involving Israel and Iran have catalyzed widespread cryptocurrency liquidations, driving Bitcoin closer to $60,000 and intensifying downward pressure across altcoin markets including SOL
The Solana network’s native token SOL has settled at the $78 price point, marking a substantial 72% retreat from its historic peak of $295. This decline unfolds against a backdrop of widespread cryptocurrency market weakness, compounded by escalating geopolitical friction as of February 28, 2026.
Military strikes targeting Iran were initiated by Israel during Saturday morning hours in the local timezone. U.S. forces reportedly joined the operation, according to Associated Press intelligence sources. The cryptocurrency market responded immediately, with Bitcoin experiencing a sharp 5% decline approaching the $60,000 threshold, triggering cascading losses across alternative cryptocurrencies including Solana.
While token valuation has suffered, Solana’s underlying network metrics paint a different picture. The blockchain facilitated $108 billion in decentralized exchange transaction volume throughout the previous 30-day window, outperforming Ethereum’s $63.7 billion and Base’s $31.48 billion.
Within the most recent 24-hour timeframe, application revenue generated on Solana totaled $3.1 million, marginally exceeding Ethereum’s $2.95 million. The Solana network recorded 2.17 million active wallet addresses during this period, significantly higher than Ethereum’s 682,236 active addresses.
The real-world asset tokenization sector on Solana has achieved a new milestone valuation of $1.71 billion, representing a 45% expansion over the past month.

SOL ETF Flows Hold Steady
Exchange-traded funds offering spot SOL exposure debuted in late October 2025, attracting more than $100 million in average net capital inflows throughout their initial five-week trading period. Recent weekly inflow figures have moderated to the $20–$25 million range as token prices have declined.
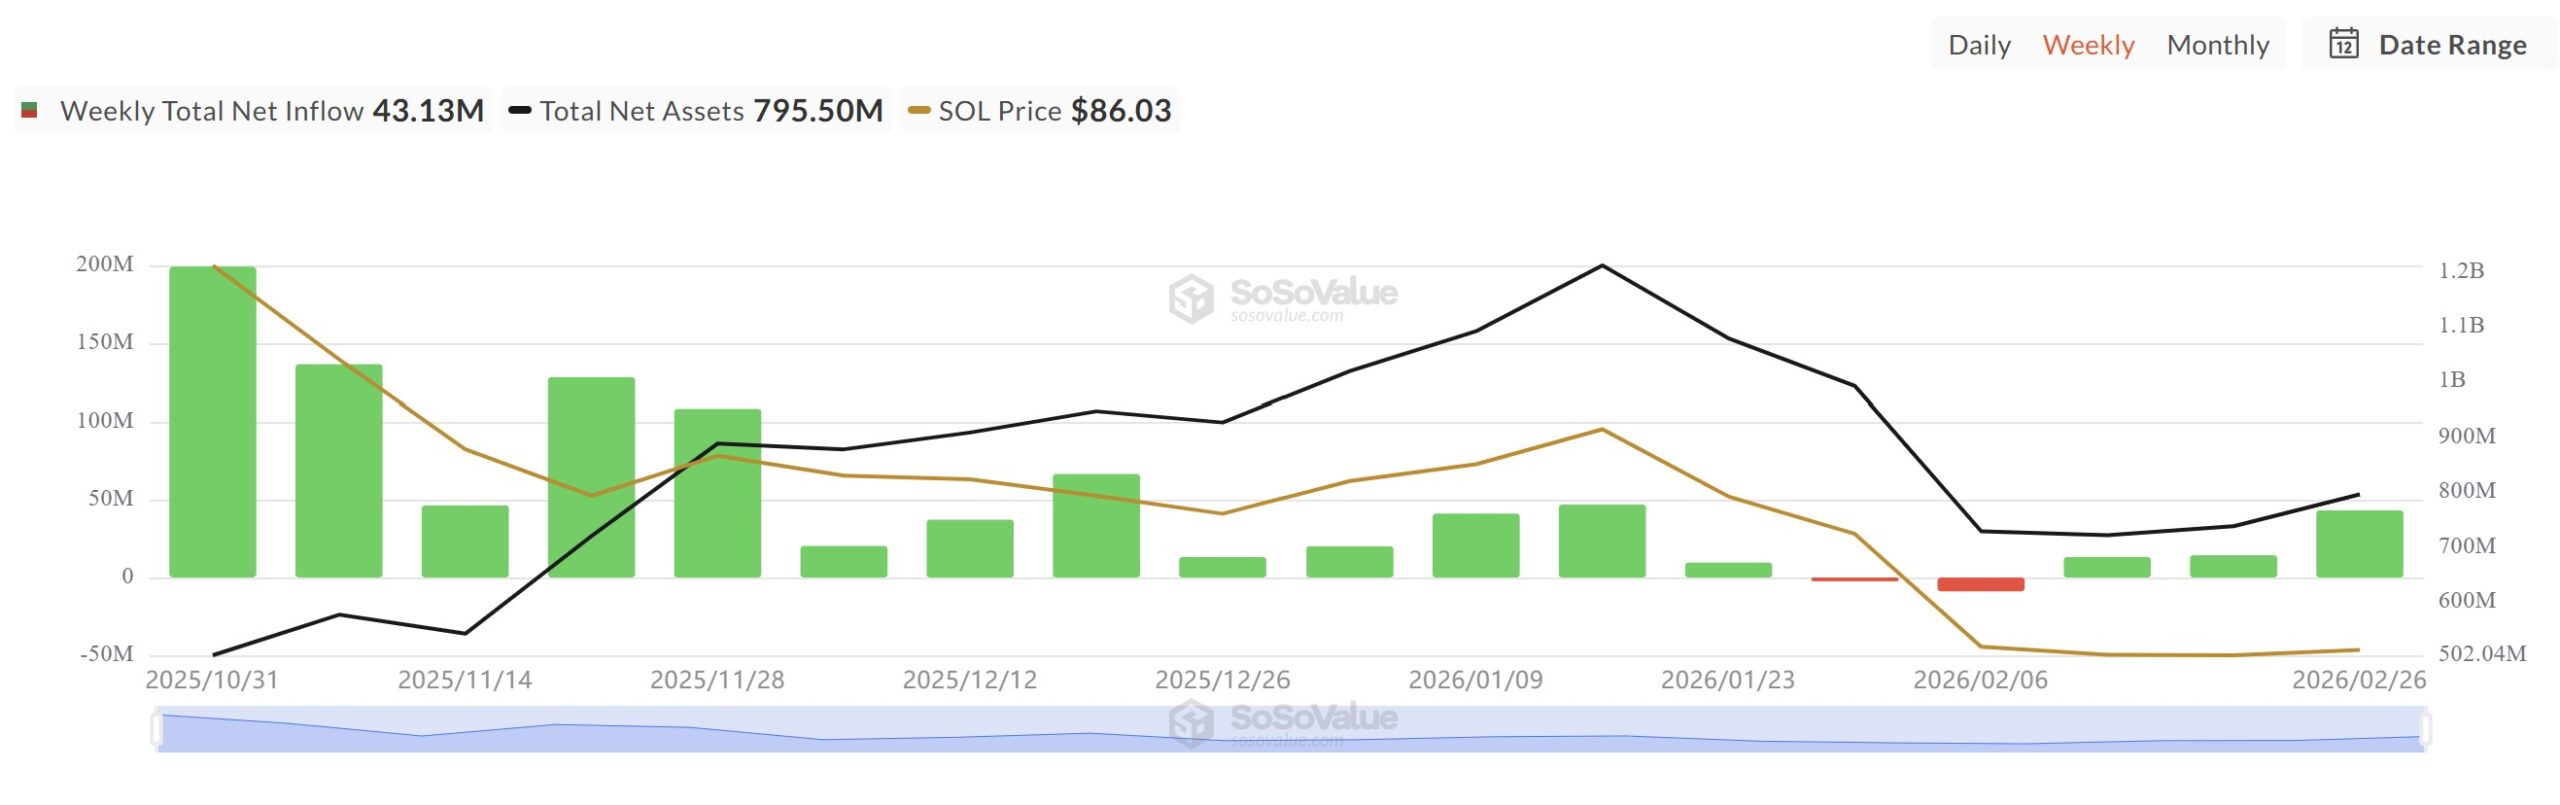
Aggregate outflows spanning the four-month price drawdown amount to merely $11.3 million across a two-week window. Comparable investment vehicles for Bitcoin and Ethereum experienced four consecutive months of net negative capital flows during the identical timeframe.
Solana presently trades substantially below the $188 valuation observed when its ETF products initially launched.
Key Support Levels to Watch
Cryptocurrency analyst Ali Martinez has highlighted a Parallel Channel formation emerging on SOL’s weekly price chart. This technical pattern suggests support levels positioned at $50.22, $22.47, and $9.98.
Market analyst Crypto Scient has identified two supplementary zones of interest. The primary area encompasses the 0.75 Fibonacci retracement band spanning $60 to $70. The secondary zone represents a weekly demand fair value gap situated between $22 and $29.
Unspent transaction output analysis from Glassnode reveals that more than 6% of circulating SOL supply last transacted within the current price cluster. The subsequent major supply concentration, exceeding 3%, resides in the $20 to $30 range.
SOL presently trades beneath the weekly resistance threshold of $120. The $51 to $80 corridor on weekly timeframes has undergone testing and corresponds with the retracement zone under analyst scrutiny.
As of February 28, 2026, SOL maintained the $78 price level while cryptocurrency markets absorbed developments from the Israel-Iran military engagement.
Get 3 Free Stock Ebooks
Discover top-performing stocks in AI, Crypto, and Technology with expert analysis.
- Top 10 AI Stocks - Leading AI companies
- Top 10 Crypto Stocks - Blockchain leaders
- Top 10 Tech Stocks - Tech giants


