
 Sees $220M in Short Liquidations as Volatility Reaches Multi-Month Highs")
Key Takeaways
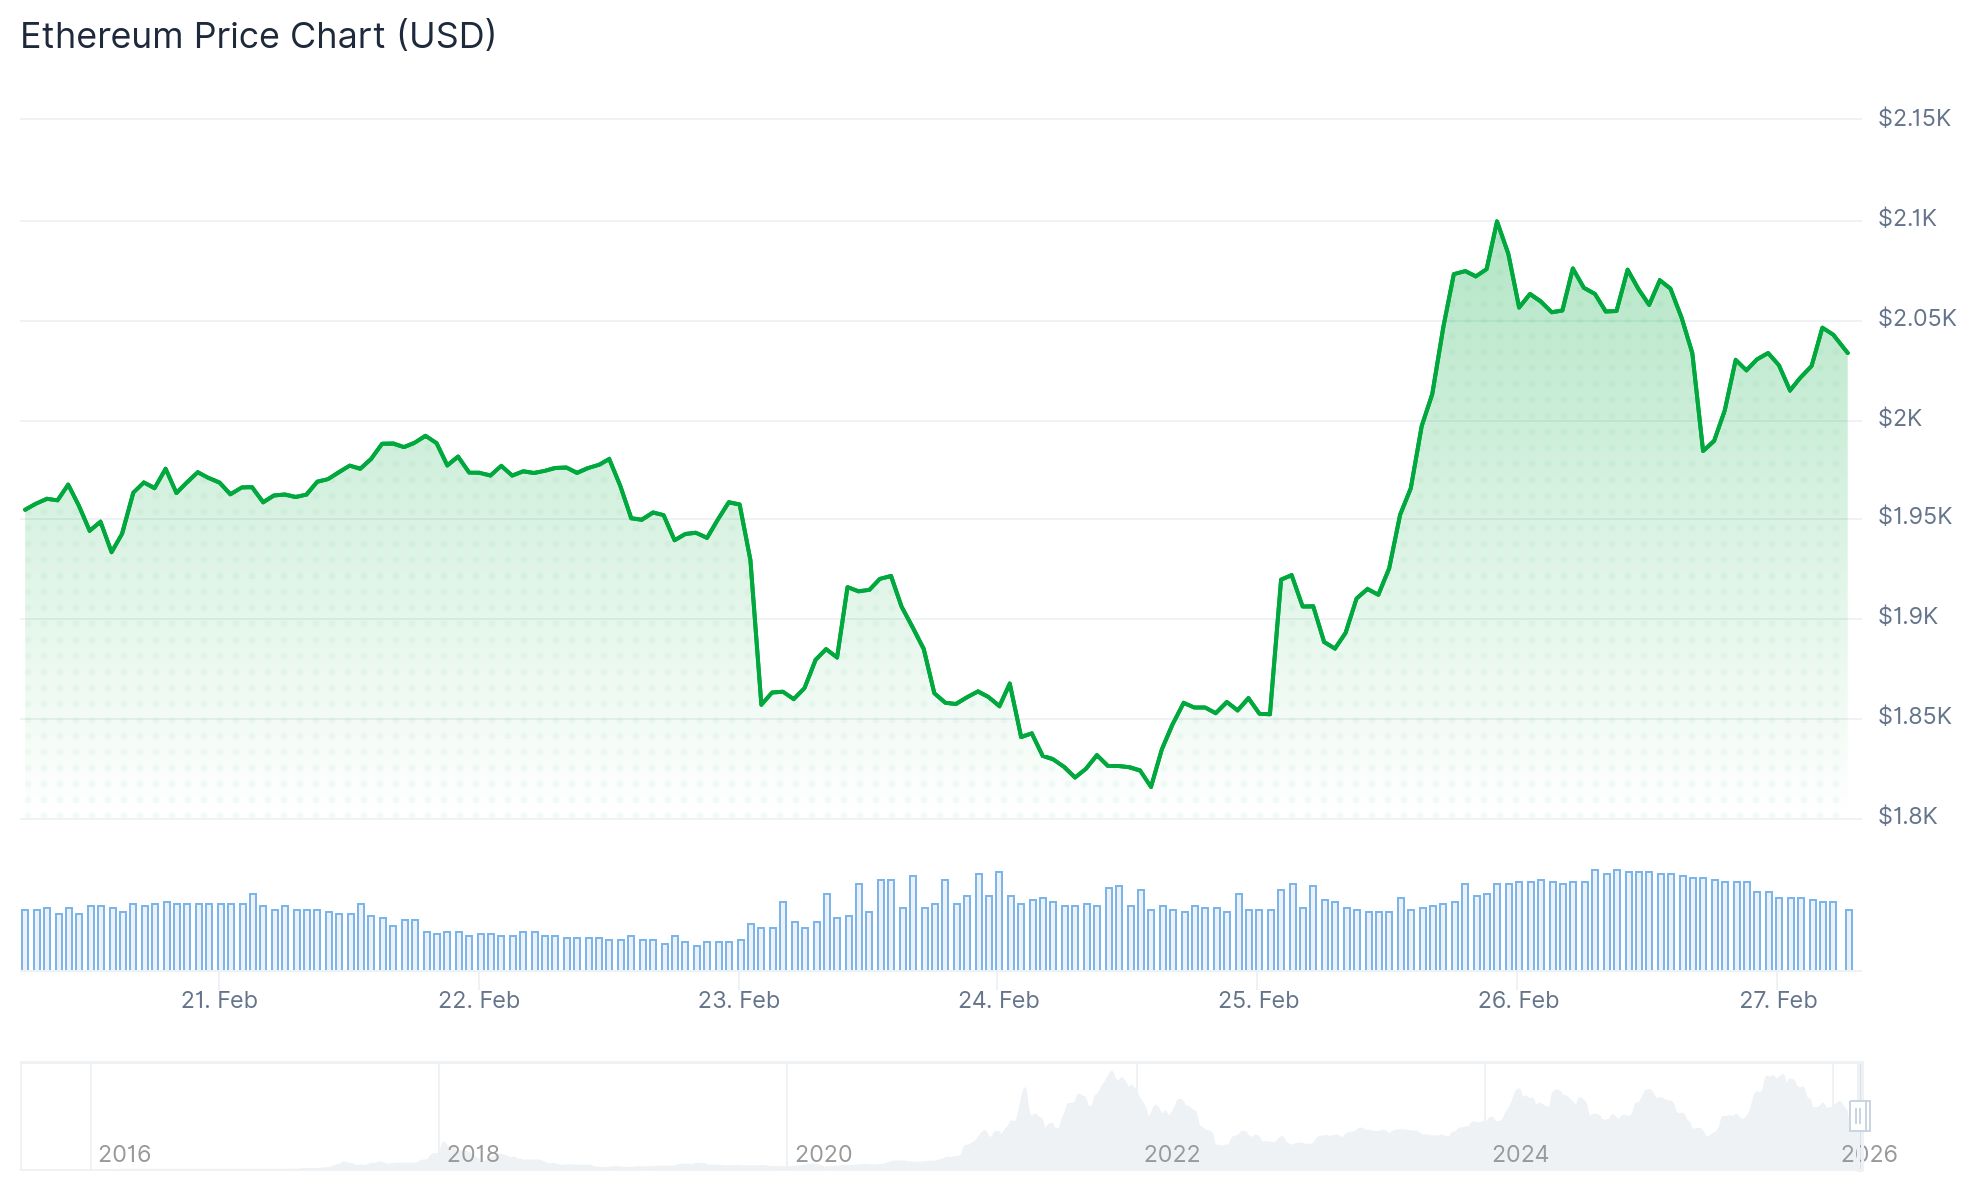
- ETH briefly climbed to $2,150 this week but met resistance at multiple technical levels
- The $2,100 threshold aligns with the realized price for whale addresses holding over 100,000 ETH
- ETH’s 30-day realized volatility nears 0.97, reaching the highest level observed since March 2025
- Over $220M in short positions were liquidated within a 48-hour window as funding rates flipped positive
- ETF selling momentum appears to be easing, though clear accumulation patterns have not yet emerged
Ethereum climbed to the $2,150 mark during Thursday’s session before pulling back. The digital asset remains confined within a tight trading range, where $2,000 acts as pivotal support while $2,100 presents itself as the next major resistance level.
A daily close above the $2,100 level holds substantial importance, as this price aligns with the realized price for whale wallets containing at least 100,000 ETH. This realized price metric calculates the average purchase cost based on the most recent on-chain transaction, offering a window into whether large holders are currently in profit.
Looking at historical patterns from 2020 forward, ETH has infrequently dropped below this whale cohort’s cost basis, with 2022’s bear market standing as the primary exception. Past encounters with this level have often served as springboards for price rebounds.
Derivatives Market Dynamics
The futures market experienced over $220 million in short liquidations during the past 48 hours, wiping out significant leveraged bearish bets. Binance funding rates, which dropped sharply negative in early May as short interest mounted, have now flipped to positive 0.23%.
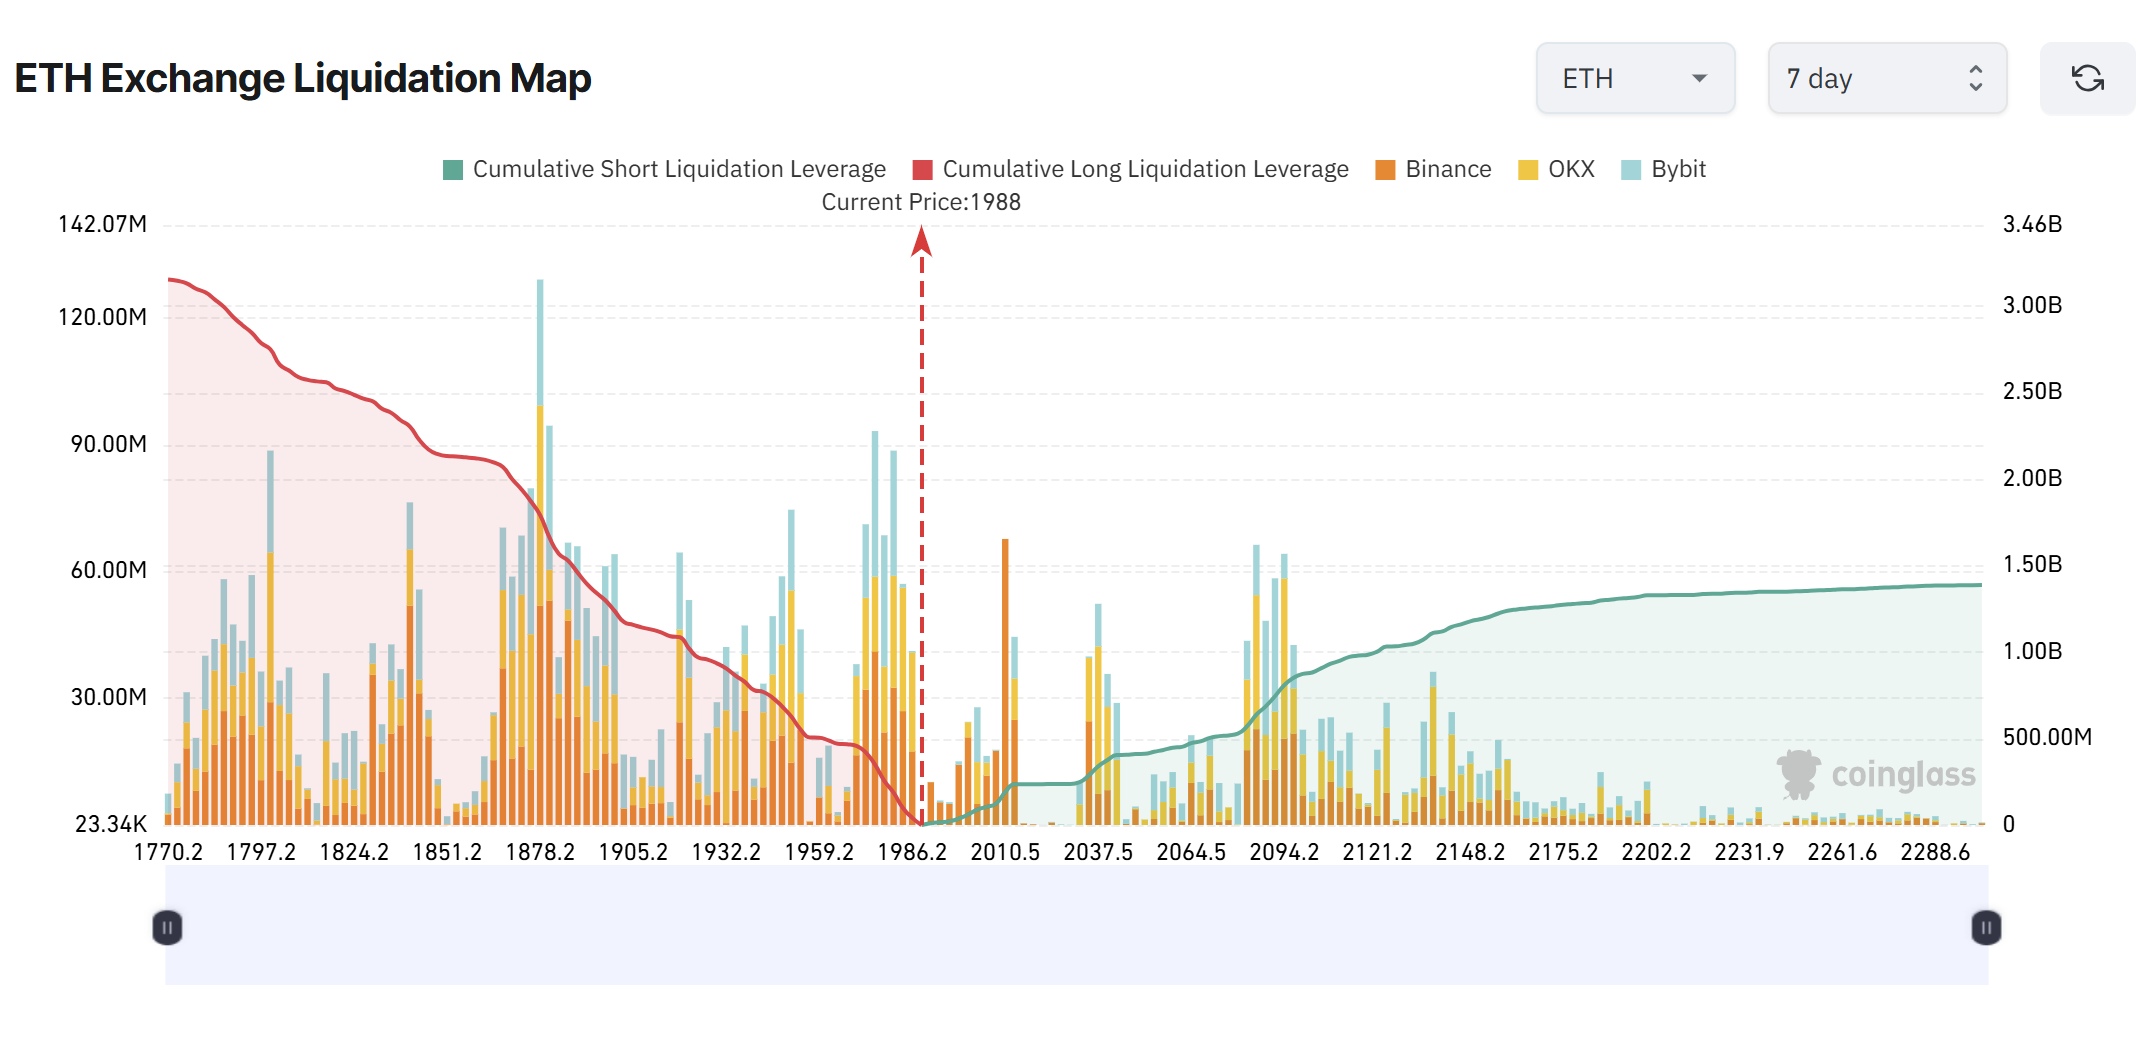
This shift demonstrates that traders who entered short positions late in the downturn were forced to exit. However, with funding rates now elevated in positive territory, the market structure currently favors long positions, potentially setting the stage for a long squeeze toward $1,800 if bullish momentum fades.

Roughly $2.66 billion in long liquidation exposure sits concentrated around the $1,800 area, creating a significant liquidity zone below present price levels.
Market Volatility and Fund Flows
Ethereum’s 30-day realized volatility on Binance has risen to roughly 0.97, marking the highest reading since March 2025. Elevated volatility during this period may signal market hesitation and directional ambiguity rather than confirming a definitive trend.
Price movement remains below the 50-day, 100-day, and 200-day moving averages. Since the rejection from near $4,800 in late 2025, each rally attempt has produced lower highs, pointing to ongoing distribution activity.
On the ETF front, selling pressure shows signs of abating. After experiencing significant outflows during mid-2025, recent flow data reveals reduced activity in both directions. Institutional selling appears to be slowing, though clear accumulation behavior has not yet surfaced.
Market analyst Leon Waidmann noted that retail traders with weak conviction have largely exited the market. Short interest is declining steadily, while heavily leveraged long positions have been hesitant to build substantial exposure.
Technical analyst IncomeSharks pinpointed three resistance zones overhead, featuring multiple SuperTrend rejections and channel resistance situated near $2,250. The analyst also emphasized April’s lows around $1,500 as a crucial downside target if buying pressure deteriorates again.
As of this writing, ETH trades at $2,034.
Get 3 Free Stock Ebooks
Discover top-performing stocks in AI, Crypto, and Technology with expert analysis.
- Top 10 AI Stocks - Leading AI companies
- Top 10 Crypto Stocks - Blockchain leaders
- Top 10 Tech Stocks - Tech giants


