
 Rallies 10% as Technical Breakout Targets $110")
TLDR
- SOL rallied 10–13% within 24 hours, touching an intraday peak around $89
- Bitcoin’s recovery past $67K has sparked renewed momentum across altcoins
- US spot Bitcoin ETFs attracted $258 million in net inflows on February 24
- Spot Solana ETFs have accumulated $40 million in net inflows since early February
- Critical resistance zones for SOL are positioned at $90, $95, and $100
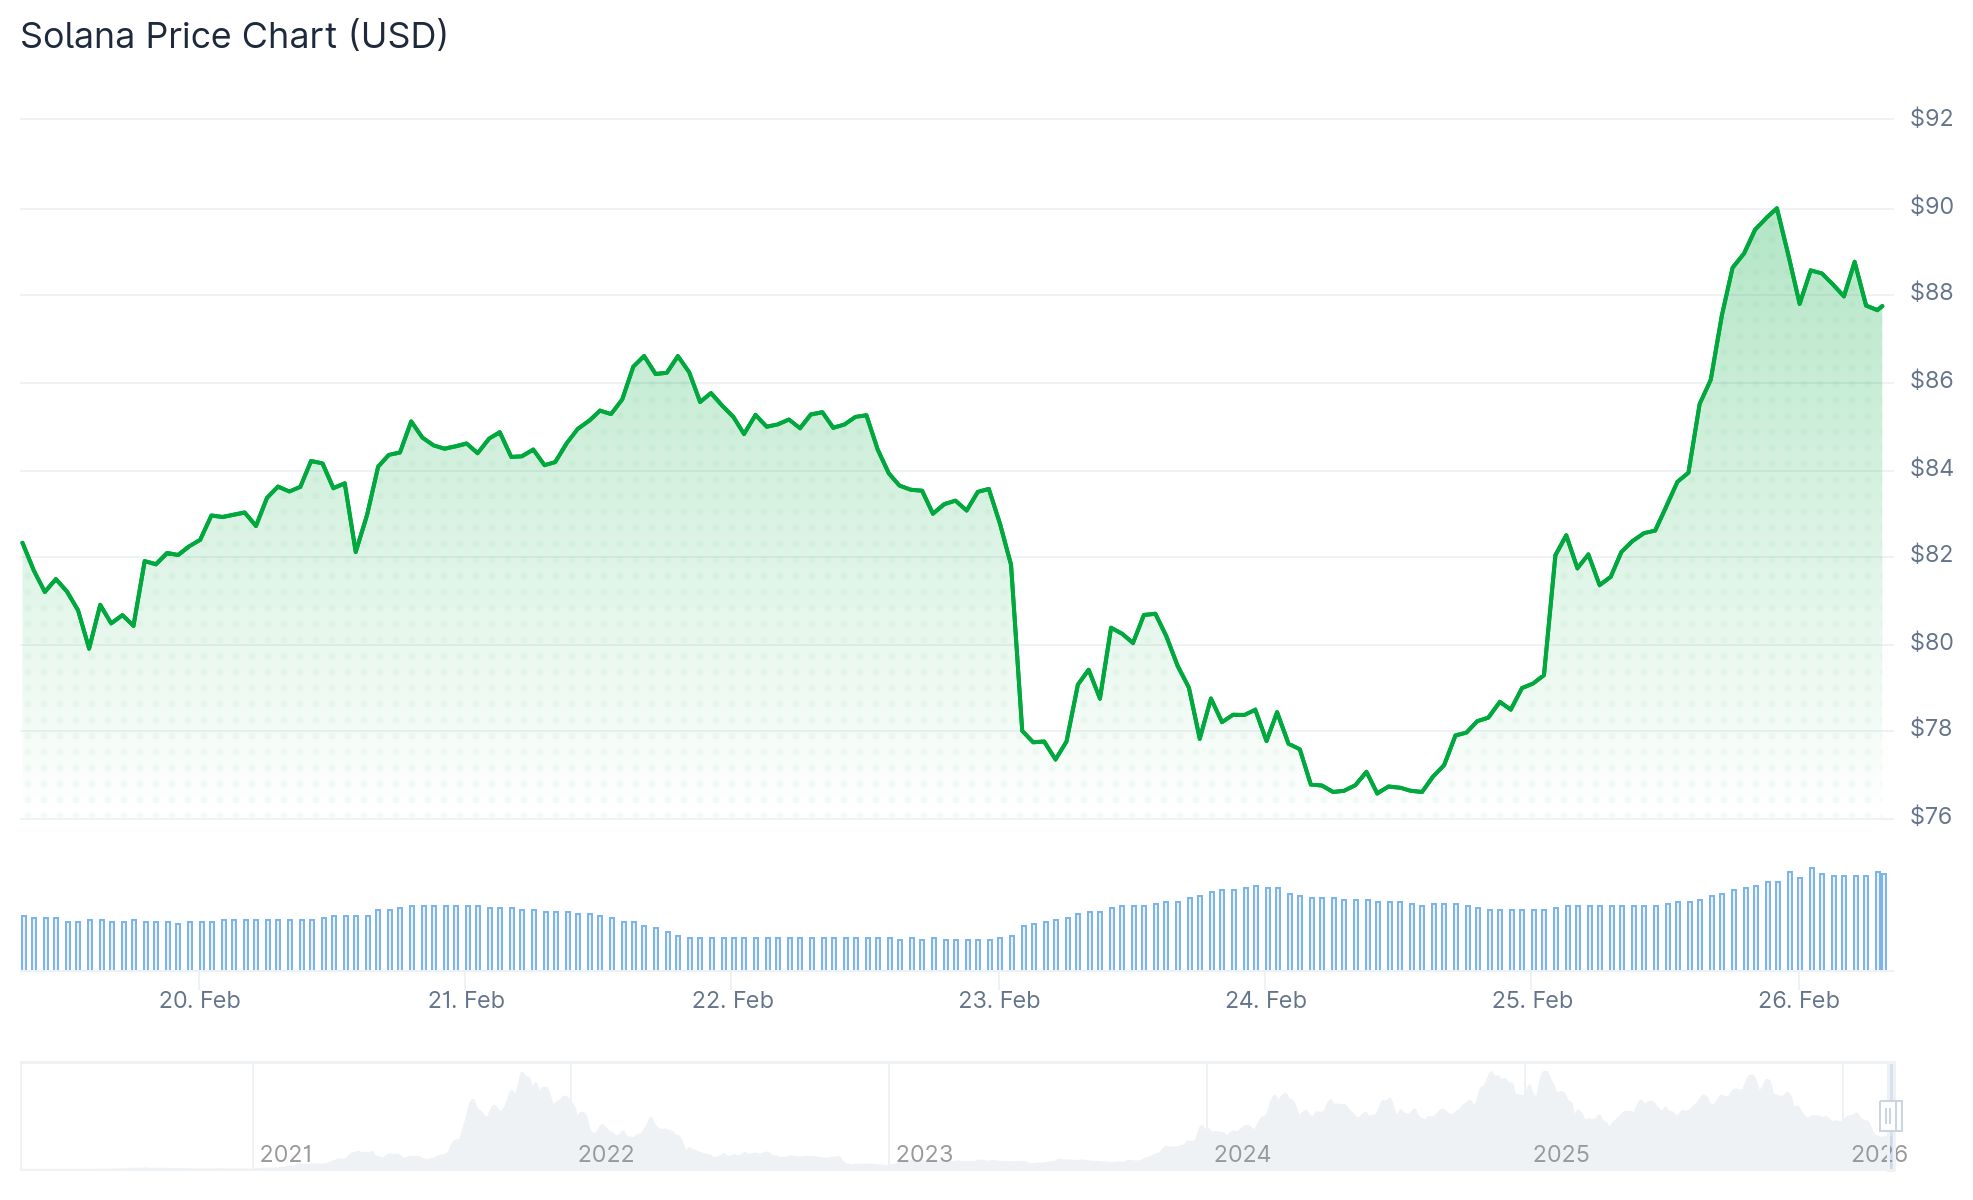
Solana’s valuation rocketed more than 10% over a 24-hour span, rebounding from a two-week bottom of $75 to approach $89 during intraday trading. This upward movement coincided with a broader cryptocurrency market revival that pushed aggregate market capitalization to approximately $2.28–$2.38 trillion.
Bitcoin spearheaded the market rebound, advancing over 5% to settle in the $66,800–$68,000 trading range. This positive momentum cascaded through major alternative cryptocurrencies, with Ethereum climbing 8%, XRP advancing 6%, and Dogecoin registering similar upward movement.
Institutional investment continued flowing into cryptocurrency products, with US-listed spot Bitcoin ETFs registering $258 million in net inflows on February 24. Fidelity’s FBTC dominated with $82.8 million, signaling fresh institutional appetite.
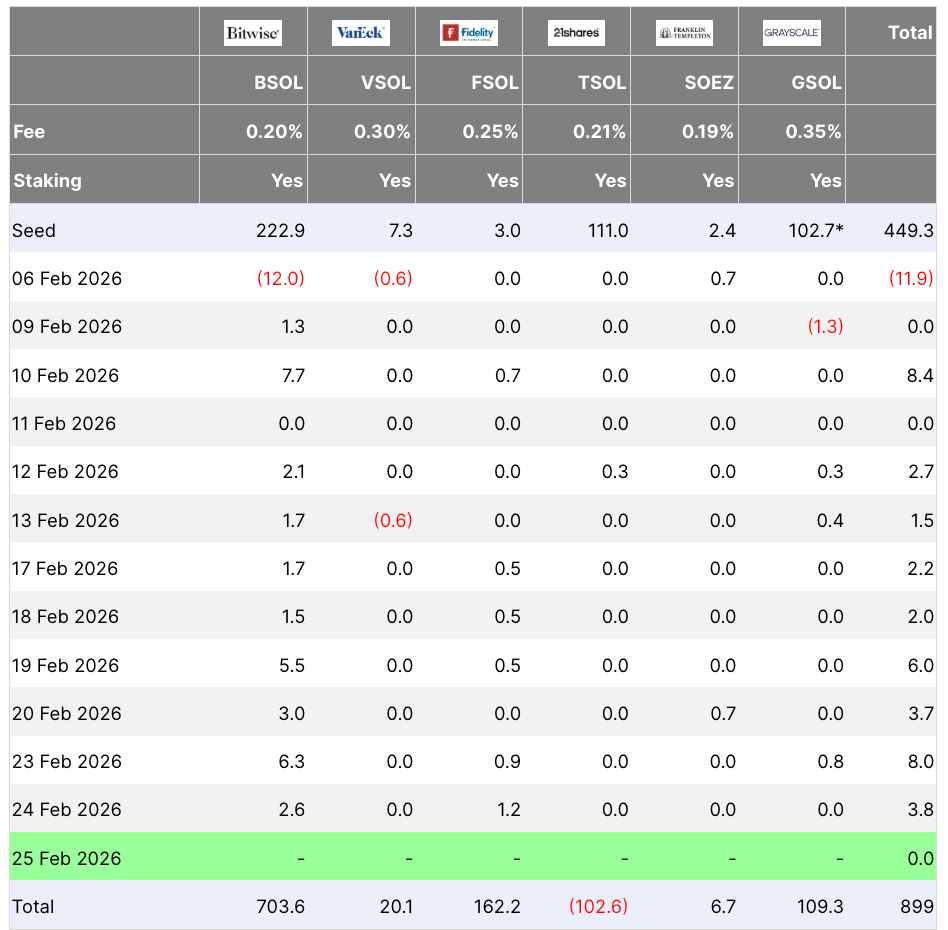
Demand specifically for Solana products intensified as well. Spot Solana ETFs have attracted $40 million in cumulative net inflows starting February 9, contributing additional upward pressure on SOL’s price action.
SOL’s open interest expanded over 5% to reach $5.27 billion during this price appreciation. Short positions faced significant pressure, with liquidations amounting to $15.4 million recorded throughout the identical 24-hour window.

Technical Breakout in Play
Analyzing the six-hour timeframe reveals SOL penetrated above a symmetrical triangle formation. The measured projection from this technical breakout indicates a potential target of $110, which aligns with the 50-day simple moving average.
Maintaining this bullish trajectory requires price action to defend the 100-day SMA positioned at $86. A daily closing price exceeding the 20-day EMA at $88 may unlock progression toward $95 and subsequently $117, market analysts suggest.
Glassnode analytics reveal minimal historical accumulation above $85, indicating fewer holders maintaining underwater positions in that price zone. This dynamic could diminish selling pressure from above in the immediate term.
The Relative Strength Index registered 72.84 at press time, indicating overbought conditions. The MACD displayed a bullish intersection with a histogram value approximating 1.20.
What Needs to Happen Next
Market observers indicate that Bitcoin establishing support above $72,000 could catalyze Solana’s advance toward the $100 milestone.
Near-term resistance for Solana exists at $90, followed by $95, with $100 representing a significant psychological barrier. The subsequent major resistance emerges around $115, where approximately 22 million SOL tokens were historically accumulated.
Macroeconomic catalysts scheduled this week include Thursday’s jobless claims report, Friday’s January Producer Price Index release, and presentations from eleven Federal Reserve officials.
At the time of writing, SOL was changing hands at $88.56, having reached a session peak of $89.19 and a trough of $85.98.
Get 3 Free Stock Ebooks
Discover top-performing stocks in AI, Crypto, and Technology with expert analysis.
- Top 10 AI Stocks - Leading AI companies
- Top 10 Crypto Stocks - Blockchain leaders
- Top 10 Tech Stocks - Tech giants


