

TLDR
- Ethereum breaks down from a bear flag pattern, targeting a potential low of $2,140.
- ETH has dropped 28% in 30 days and over 6% in the past 24 hours.
- Long-term holder NUPL trending down, nearing its June cycle-low of 0.28.
- ETH sits below key cost-basis support between $2,801 and $2,823.
Ethereum is under intense selling pressure after breaking down from a key bear flag pattern, signaling a potential 28% drop. The price has already fallen over 6% in 24 hours and 27% in the past month, triggering bearish momentum. On-chain data and technical indicators now point to a downside target near $2,140, raising concerns that Ethereum may not have found its bottom just yet.
Bear Flag Breakdown Sets ETH on Path Toward $2,140
Ethereum has broken below a major continuation pattern known as a bear flag, activating a potential downside target of $2,140. The move follows a sharp decline from its recent local high near $2,990. Over the past 30 days, ETH has lost about 27% of its value, including a 6% drop in the last 24 hours.
The measured target from the bear flag breakdown aligns with the 28% drop from the pattern’s formation. The breakdown was confirmed after ETH failed to hold above $2,990 and exited the rising channel that had held for several weeks.

The pattern suggests further downside unless ETH can recover and close above key resistance levels. Analysts point out that the next critical level to watch is $2,840, followed by $2,990 and $3,090. A close above $3,240 would invalidate the bearish structure entirely.
On-Chain Metric NUPL Supports Further Weakness
The Long-Term Holder Net Unrealized Profit/Loss (LTH NUPL) metric supports the same bearish outlook. This indicator has been trending down since August 22, suggesting weakening long-term holder conviction.

As of November 21, NUPL had dropped to 0.36. The lowest reading in the last six months was 0.28, recorded on June 22, when ETH traded near $2,230. From that level, ETH rallied by 116% to reach highs near $4,820.
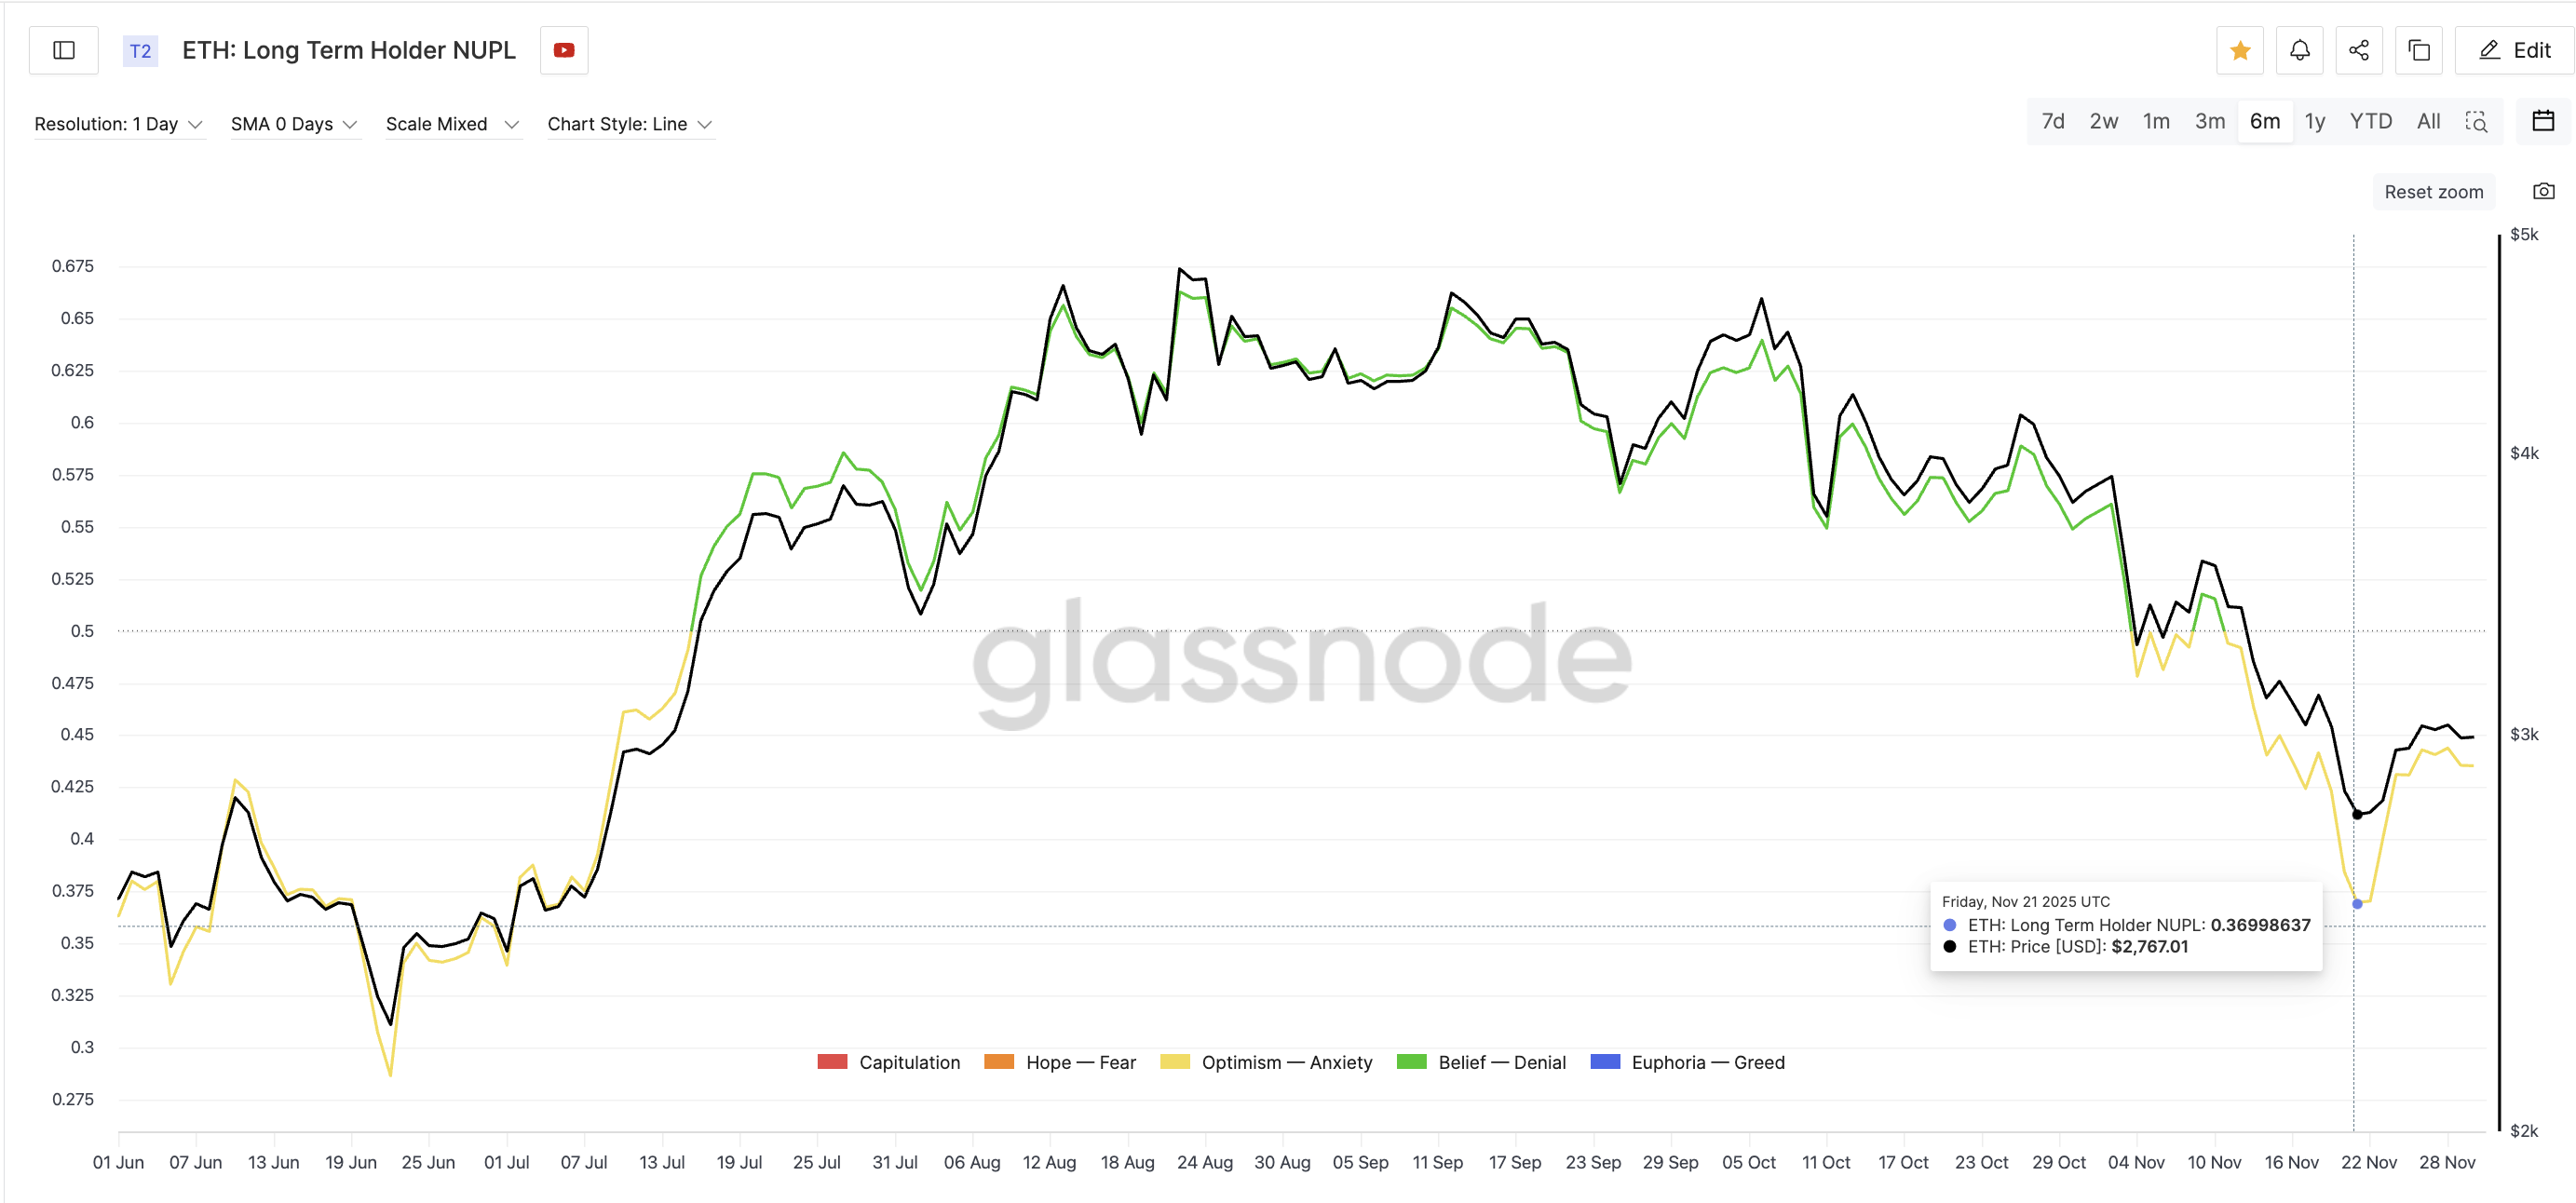
If NUPL retests that low again, it would imply a price drop of about 20–25% from the $2,990 local high, placing ETH between $2,260 and $2,140. This aligns closely with the target from the bear flag breakdown.
Cost-Basis Support Levels: Breaking Down
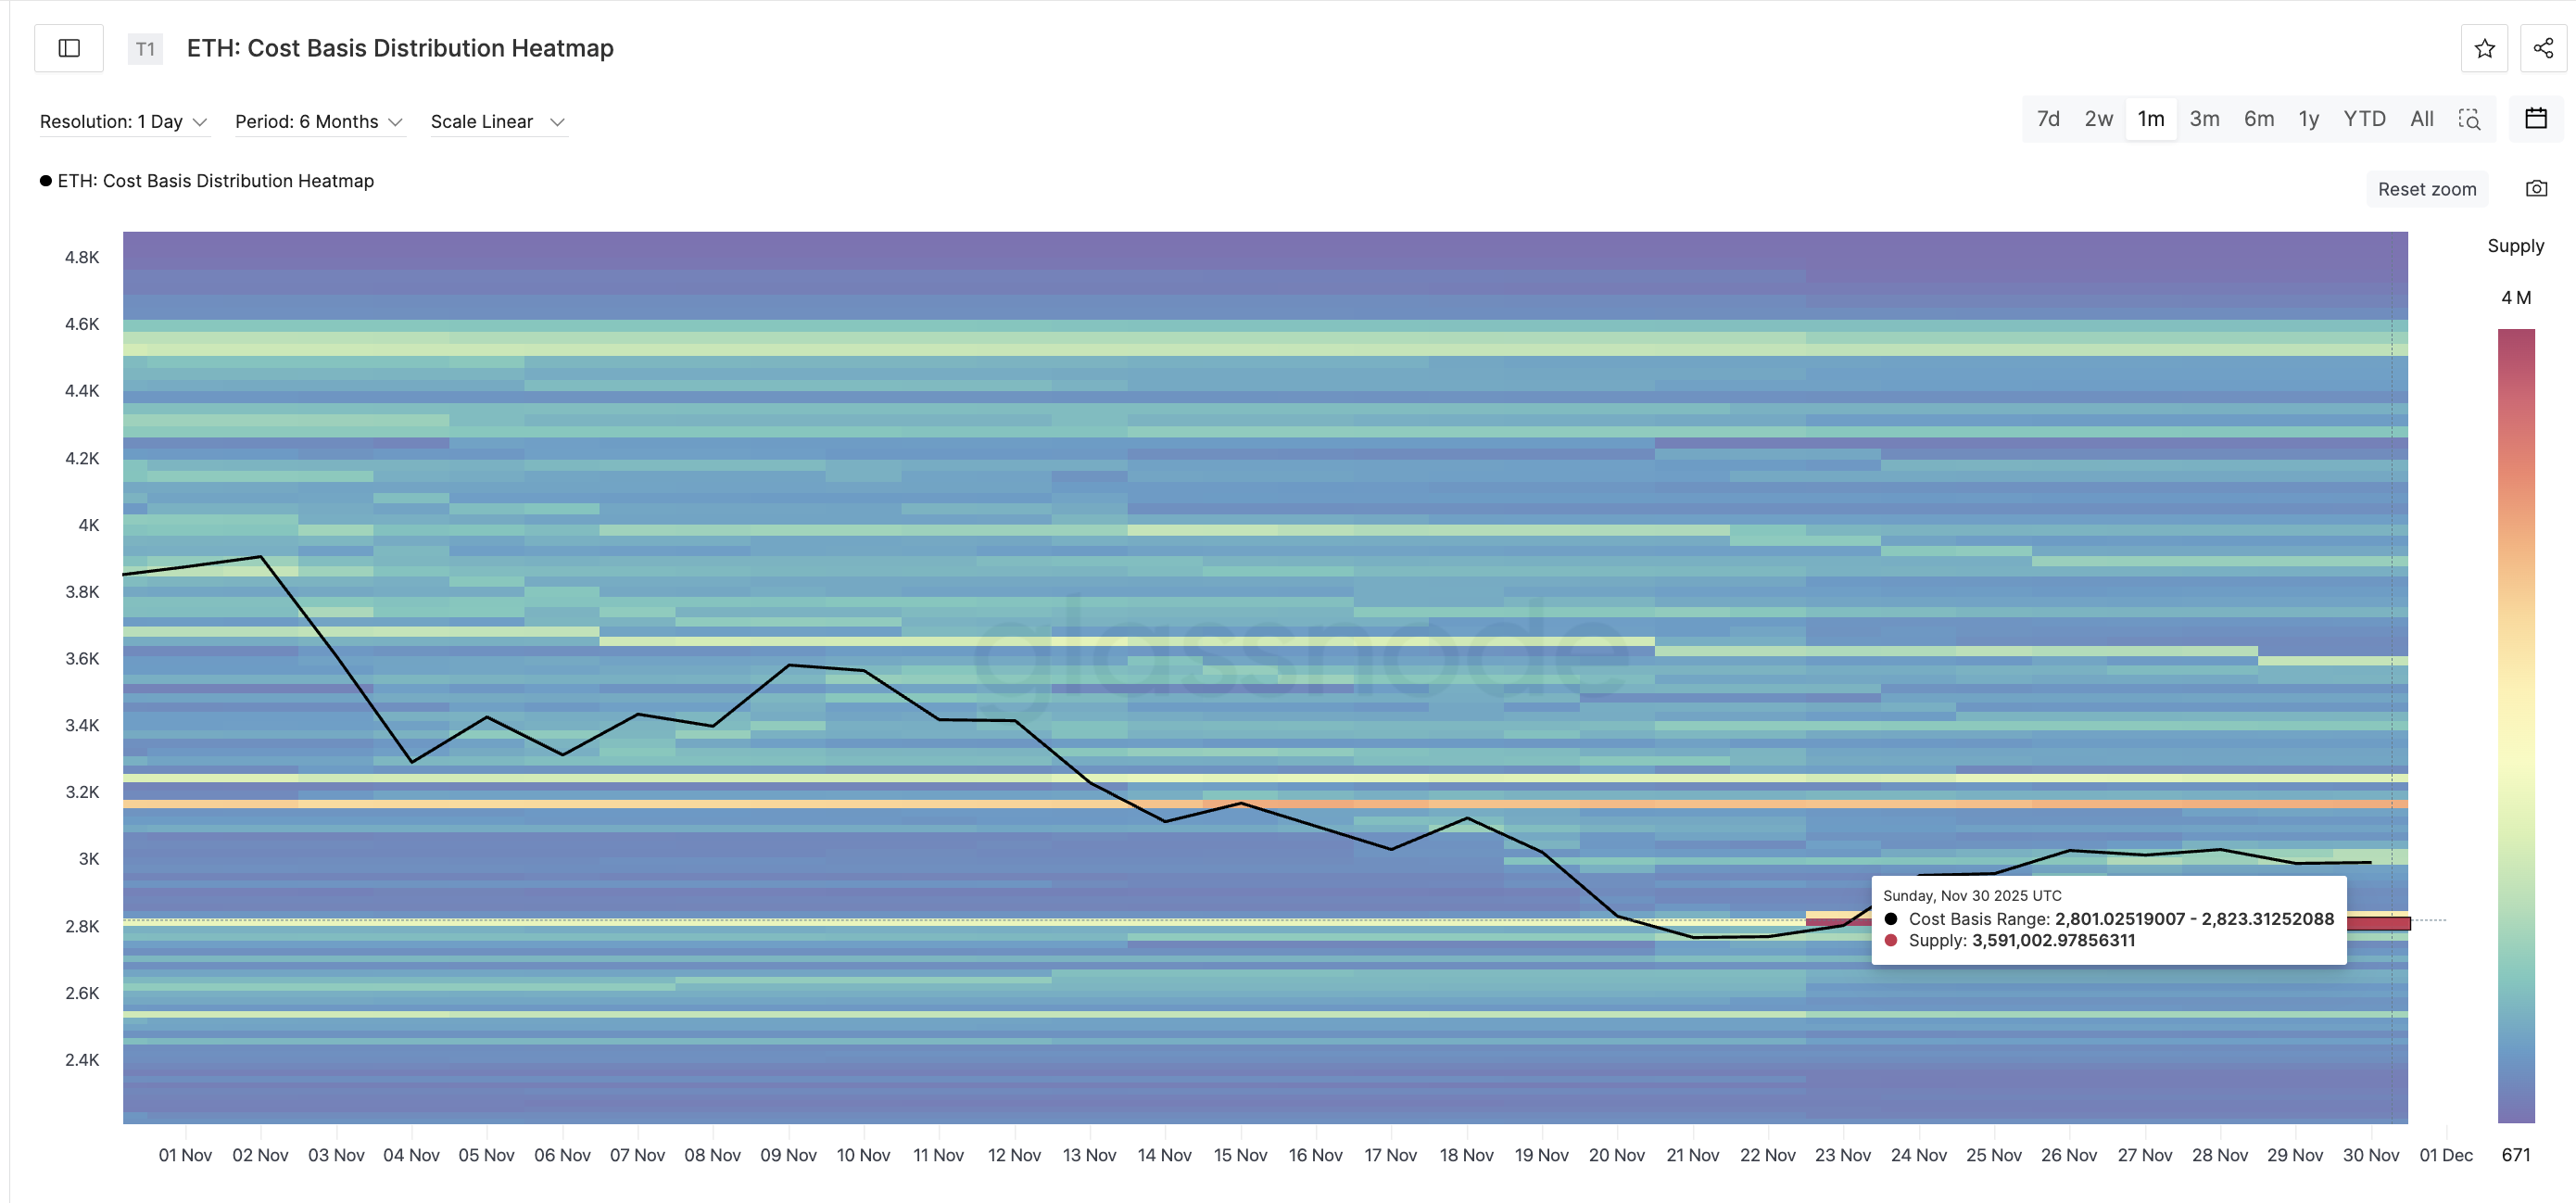
Glassnode’s Cost Basis Distribution Heatmap shows that the strongest support for Ethereum was between $2,801 and $2,823. Over 3.59 million ETH were acquired in that price range. However, Ethereum has already slipped below this zone, indicating weakened support.
The next lower levels are spaced closely and include $2,690, $2,560, and $2,440. Below these, $2,260 is near the June low, while $2,140 completes the bear flag target. If Ethereum continues to trade below its cost-basis wall, more sellers may step in.
Should ETH fail to reclaim these levels quickly, analysts believe the downward momentum may persist. If price breaks below $2,266, the path to $2,140 becomes the dominant scenario.
Resistance Levels Must Be Reclaimed to Invalidate Pattern
There is still an upward path that could invalidate the bearish pattern. Ethereum would need to close above $2,840, then move beyond $2,990. If this happens, further gains could push the price toward $3,090 and potentially $3,240.
A decisive move above $3,240 would negate the bear flag structure and return ETH to bullish conditions. Until then, downside risks remain higher. As of now, the long-term holder metric and technical setup both signal a move toward the $2,260–$2,140 zone.
Get 3 Free Stock Ebooks
Discover top-performing stocks in AI, Crypto, and Technology with expert analysis.
- Top 10 AI Stocks - Leading AI companies
- Top 10 Crypto Stocks - Blockchain leaders
- Top 10 Tech Stocks - Tech giants


