

- XRP tests $2.29 support amid Ripple’s billion-dollar expansion.
- Ripple enters $120 trillion treasury payments market with G-Treasury.
- Analyst draws parallels between 2025 and XRP’s 2017 rally setup.
- Extreme fear readings mirror conditions seen before previous bull runs.
The XRP price is hovering near $2.23 after a sharp correction from its September highs above $3.00. According to analyst Steph is Crypto, the token has reached a critical point on the daily chart, testing the 0.382 Fibonacci retracement level at $2.29. This zone has historically served as a key turning point for XRP. This defines whether market corrections transform into deeper declines or renewed rallies.
The chart shows XRP moving within a structured downtrend since mid-2025, consolidating after a strong earlier rally. Beneath the current price, additional support areas sit around $1.95, marking the 0.5 retracement, and between $1.60 and $1.51, which align with the 0.618–0.65 Fibonacci cluster. These levels often act as long-term accumulation zones during cyclical resets.
Historically, XRP price market cycles have been shaped by these Fibonacci retracements. In both the 2017 and 2021 rallies, the 38%–61% range represented equilibrium zones before major recoveries began.
Data from November 2024 to October 2025 confirms a similar pattern, with multiple retests around the mid-range Fibonacci supports, suggesting that buyers continue to defend these long-term structures.
Ripple’s $1 Billion Acquisition Strengthens Corporate Payments Expansion
While XRP tests its crucial price structure, Ripple is making one of its boldest corporate moves to date. Chief Executive Officer Brad Garlinghouse announced the $1 billion acquisition of G-Treasury, a deal that positions Ripple at the center of the $120 trillion global corporate treasury payments market.
According to reports, Garlinghouse noted that trillions of dollars remain locked in inefficient, outdated payment systems, creating barriers to liquidity access and global cash flow. By combining G-Treasury’s long-standing enterprise network with Ripple’s blockchain infrastructure, the company aims to unlock this trapped capital through faster and cheaper settlement.

The partnership will enable global CFOs to manage their balance sheet assets, including stablecoins, tokenized deposits, and digital treasuries, while deploying idle capital into repo markets through Ripple’s liquidity partners.
This move reinforces Ripple’s broader mission to modernize international payments and demonstrates its ongoing transition from pure crypto solutions to large-scale financial infrastructure. Ripple has steadily expanded its institutional presence, with its technology already supporting cross-border payments for financial institutions across Africa, the Middle East, and Asia. The G-Treasury acquisition enhances this reach, bridging traditional treasury management and blockchain-based liquidity.
Technical Structure Mirrors XRP’s 2017 Price Cycle
The weekly comparison chart shared by Steph is Crypto shows clear similarities between XRP’s 2017 bull cycle and its 2025 market structure. In 2017, after months of sideways consolidation and heavy fear sentiment, XRP surged by over 10,000%, transforming from one of the market’s laggards to a top-performing asset. The same technical pattern appears to be forming again, as the weekly chart highlights a near-identical capitulation zone labeled.
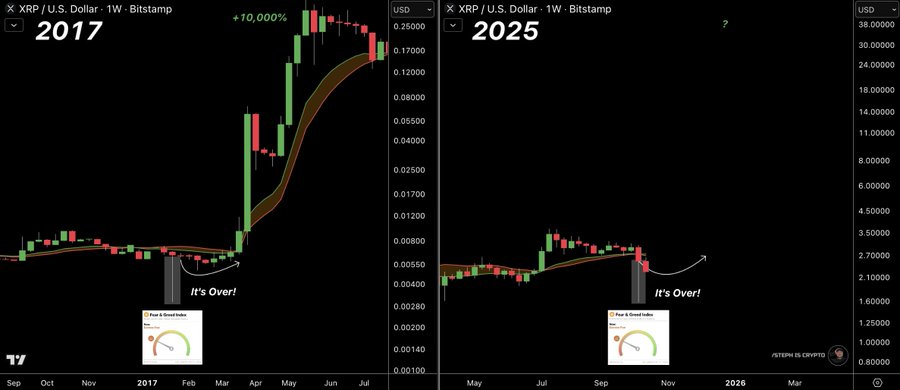
XRP Comparison Chart | Source: Steph on X
The Fear and Greed Index, currently positioned in “Extreme Fear,” also echoes the 2017 pre-rally phase. This sentiment pattern, combined with compressed volatility and declining volume, mirrors the exhaustion stages that preceded XRP’s major uptrend eight years ago.
Historically, the asset’s large expansions began only after weekly closes regained strength above the moving average bands, a signal traders are now watching closely.
These cyclical similarities have caught analysts’ attention, as XRP’s chart structure, retracement alignment, and sentiment readings all converge at historically reactive levels. While market conditions differ from 2017, the chart comparison reinforces how XRP’s corrections often form bases before substantial directional moves.
Disclaimer: This is a Press Release provided by a third party who is responsible for the content. Please conduct your own research before taking any action based on the content.
Get 3 Free Stock Ebooks
Discover top-performing stocks in AI, Crypto, and Technology with expert analysis.
- Top 10 AI Stocks - Leading AI companies
- Top 10 Crypto Stocks - Blockchain leaders
- Top 10 Tech Stocks - Tech giants


