

TLDR
- Ethereum’s price correlates closely with global M2 liquidity growth.
- ETH remains in accumulation phase, supported above $4,300 levels.
- Fibonacci support zones between $4,326 and $4,049 indicate correction range.
- Bullish breakout above $4,750 could send ETH toward $5,000–$8,000 range.
Ethereum price appears to be closely tracking global M2 liquidity trends, suggesting an upcoming bullish continuation. The relationship between macro liquidity and crypto asset performance has become increasingly evident as markets shift into an accumulation phase. Analysts believe this pattern could signal Ethereum’s preparation for its next major move, with projections pointing toward the $5,000–$8,000 range.
Ethereum Mirrors Global Liquidity Expansion
The chart depicting Ethereum price movement against global M2 liquidity shows a strong correlation between the two. As liquidity expands worldwide, capital inflows into risk assets such as cryptocurrencies tend to increase. Historically, Ethereum has reacted positively to these expansions, reflecting investor confidence and improving macro sentiment.

ETH/USD 1D Chart | Source: X
Currently, the network’s token trades within an accumulation zone following months of correction. This phase, often referred to as a re-accumulation period, suggests that institutional and long-term holders may be positioning ahead of the next liquidity-driven rally. Once Ethereum decisively breaks above the $4,700–$4,800 resistance zone, the chart structure implies room for a sustained move higher.
Liquidity Growth May Drive a New Bullish Cycle
Furthermore, expanding M2 liquidity globally often acts as a leading signal for crypto rallies. When central banks inject liquidity through accommodative policies, the availability of capital for high-risk investments grows. Ethereum, like Bitcoin, has historically benefited from these macro shifts, using increased liquidity as a foundation for price appreciation.
The visual projection on the chart anticipates that as global liquidity continues to climb, Ethereum could mirror this growth. With financial conditions showing early signs of easing in several major economies, the crypto market’s correlation with M2 trends remains a key indicator to watch. A breakout above the accumulation range could mark the start of Ethereum’s next macro uptrend toward $8,000.

Technical Patterns Suggest a Healthy Market Structure
In addition, Ethereum’s 4-hour chart currently displays a completed five-wave impulse pattern, signaling the end of an initial bullish leg. The fifth wave reached the $4,750–$4,800 zone, aligning with a critical resistance area. This movement indicates that while momentum remains intact, short-term exhaustion may prompt a brief correction before the next push higher.
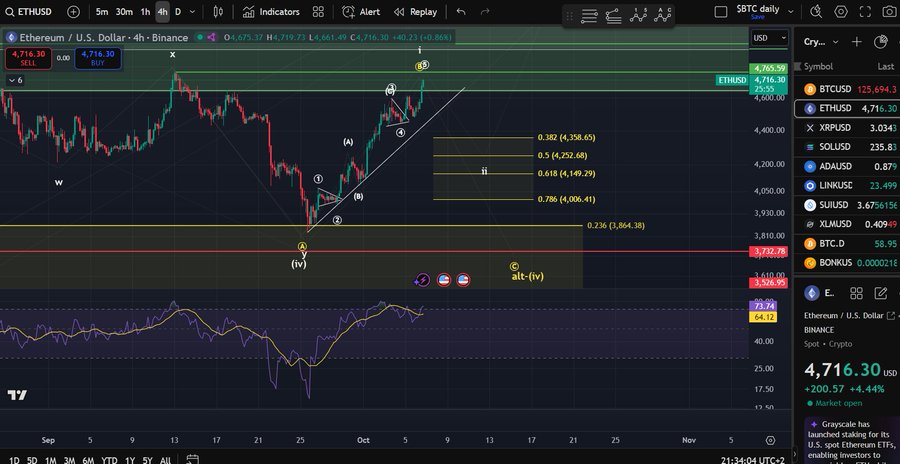
ETH/USD 4H Chart | Source: X
If a corrective wave unfolds, Fibonacci retracement levels between $4,326 and $4,049 could serve as key support zones. Holding above these levels would confirm the market’s underlying strength and preserve the bullish trajectory. However, a drop below $3,948 could shift the short-term outlook, introducing the possibility of deeper retracement before recovery.
Traders Should Remain Cautious Amid Overbought Signals
Even so, the Relative Strength Index shows mild bearish divergence as Ethereum price forms higher highs. This condition often precedes minor pullbacks or sideways consolidation. Short-term traders may interpret this as a chance to manage risk, while long-term participants might view it as another opportunity to accumulate.
Ethereum’s macro structure, supported by rising liquidity and strong demand, remains constructive. However, near-term volatility could persist as the market digests gains. Sustained movement above $4,750 would likely invalidate the correction scenario and open the path toward $5,000. The broader narrative continues to favor Ethereum’s resilience, particularly if global liquidity remains on an upward trajectory.
Get 3 Free Stock Ebooks
Discover top-performing stocks in AI, Crypto, and Technology with expert analysis.
- Top 10 AI Stocks - Leading AI companies
- Top 10 Crypto Stocks - Blockchain leaders
- Top 10 Tech Stocks - Tech giants


