

TLDR
- Bitcoin hovers around $114000 as $113800 support weakens, raising potential for further short-term decline.
- On-chain data shows realized price near $111846 with profit-taking cooling and profit/loss margin stabilizing.
- 15-minute chart forms a head-and-shoulders pattern, pointing to possible drop toward $111000 – $111400 if support breaks.
- Profit/loss 30-day average stays flat, suggesting consolidation while traders await clearer market direction.
Bitcoin is testing key short-term levels after a sharp price rally and signs of profit-taking. On-chain and intraday charts suggest the market is at a decision point as buying momentum fades. Traders now watch support near $113,800 for clues on the next direction.
On-Chain Metrics Indicate Ongoing Consolidation
Bitcoin’s on-chain data from late 2023 to September 2025 tracks realized price and profit/loss margin for short-term holders. The realized price, representing the average cost basis for coins held one to three months, stands near $111,846. Spot price remains slightly higher at about $112,316, keeping most holders in profit and providing a base for continued accumulation.
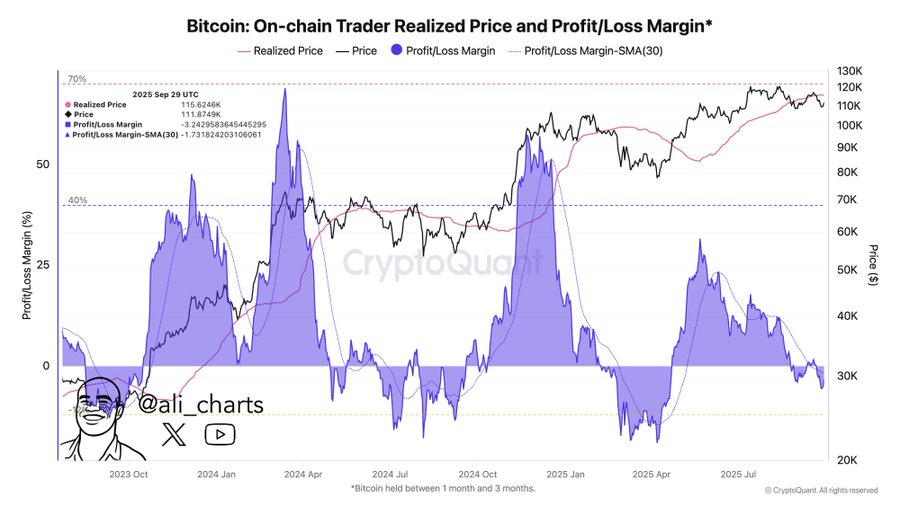
BTC OCT Chart | Source: X
Profit/loss margin, shown as a violet area on the chart, recently cooled to mid-range levels after peaks above 50% earlier in 2024 and 2025. These peaks often came before local tops, with subsequent corrections as traders secured gains. The current lower margin suggests many profits have already been taken, reducing immediate selling pressure. A steady rise in realized price over the last two years indicates that buyers continue to accept higher entry costs.
Momentum Appears to Be Flattening
Furthermore, The 30-day moving average of profit/loss margin has leveled off, signaling market consolidation. Periods when this metric reversed upward from low levels have historically preceded rallies, as seen in late 2023 and mid-2024. If the moving average begins to climb while Bitcoin trades above the realised price, renewed upward movement is possible.
Yet caution persists. A sideways-moving profit/loss trend often reflects indecision. Some holders might wait for clearer signals before re-entering the market in force. This hesitation can extend the consolidation phase, creating pressure for a decisive move.

Short-Term Chart Patterns Show Weakening Strength
In addition, The 15-minute Bitcoin/USD chart shows a sharp surge to $114,600 followed by a rounded top with three descending peaks. Such patterns often reflect reduced buying power and gradual selling. Each lower high, drawn in red, confirms weakening momentum after the initial spike.
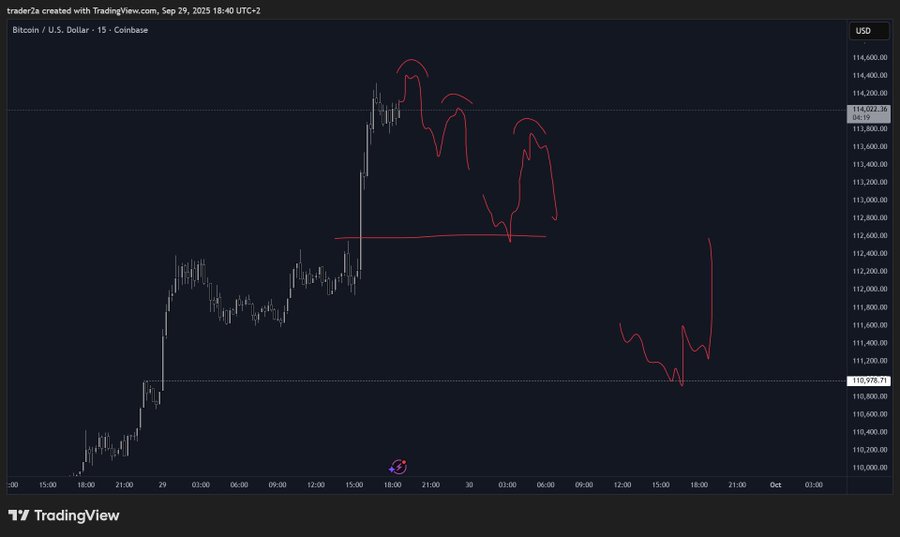
BTC/ USD M15 Chart | Source: X
The horizontal red line around $113,800 marks immediate support. Repeated tests of this level could form a head-and-shoulders neckline. A firm close below it would signal breakdown risk and could trigger a quick slide toward the $111,000 to $111,400 range.
Key Levels Could Offer Rebound Opportunities
Even so, Below $113,800, the chart points to a deeper extension toward $110,978, matching an earlier consolidation area. Traders often look for high trading volume or long wicks to confirm such a drop. A bounce from these levels may create a short-term recovery toward $112,400 or higher.
Still, the market remains balanced between cautious buyers and active sellers. A sustained hold above $113,800 could restore confidence and keep the broader uptrend intact. Conversely, a decisive breakdown might encourage a wider retracement before new buying interest builds.
Get 3 Free Stock Ebooks
Discover top-performing stocks in AI, Crypto, and Technology with expert analysis.
- Top 10 AI Stocks - Leading AI companies
- Top 10 Crypto Stocks - Blockchain leaders
- Top 10 Tech Stocks - Tech giants


