

TLDR
- Bitcoin formed an inverse head and shoulders in August, breaking above $110.5K.
- A new head and shoulders now pressures the $113.5K support zone.
- Breakdown could target $110.5K, matching the previous bullish neckline level.
- Recovery above $115K–$116K could invalidate the bearish reversal setup.
Bitcoin is testing key support levels after forming a potential reversal pattern on its 4-hour chart. Recent price action shows a clear head-and-shoulders structure, a classic signal that selling pressure may increase. The cryptocurrency has already slipped toward the $113,500 region, which now acts as the first major line of defense.
Bitcoin Price Forms Head-and-Shoulders Setup
Bitcoin recently completed an extended rally that began with an inverse head-and-shoulders pattern in late August. That formation propelled the price beyond $110,500 and into the $117,000 to $118,000 range. A strong ascending trendline provided steady support, enabling the market to climb in a controlled sequence of higher highs and higher lows.
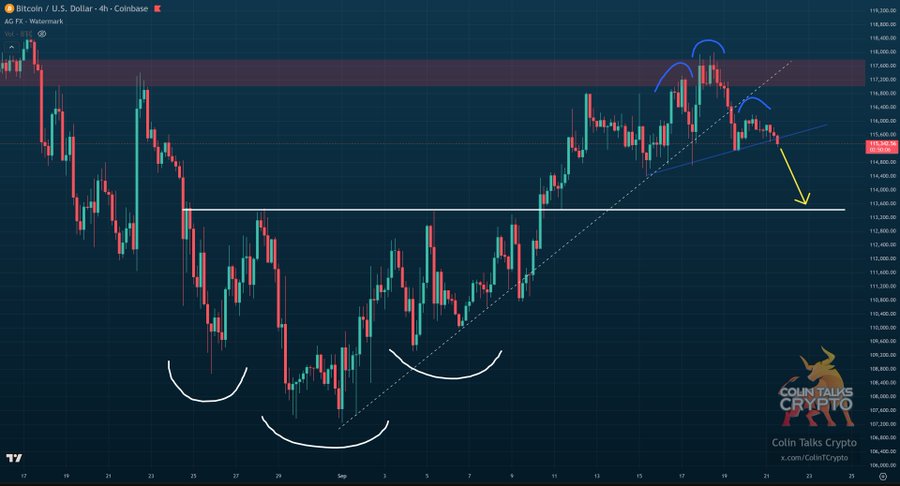
BTC/USD 4H Chart | Source: X
The current structure tells a different story. A new head-and-shoulders pattern is now visible, with two lower peaks on either side of a higher central peak. This setup often precedes downward movement if the neckline fails. Price action shows Bitcoin pressing below the dotted trendline, testing $113,500 support repeatedly. Sustained closes below this level would confirm the reversal pattern and weaken the bullish outlook.
Key Support Levels Face Pressure
Furthermore, the next significant target for bears sits near $110,500, which was the neckline of the earlier bullish breakout. This price area aligns with the measured move from the head-and-shoulders height, making it a logical downside checkpoint. Traders expect heavy buy orders around this zone, as it has previously triggered upward reversals.
Volume will likely decide how far any decline can go. Rising sell volume on a break under $113,500 would strengthen the bearish case and invite a deeper pullback. Without that confirmation, some market participants may remain cautious and wait for a clearer signal before taking positions.

Bulls Look for a Quick Rebound
In addition, not all indicators lean negative. A fast recovery above $115,000 to $116,000 could invalidate the bearish structure and shift momentum back to buyers. This scenario would suggest that the recent weakness was only a short consolidation phase within the larger uptrend.
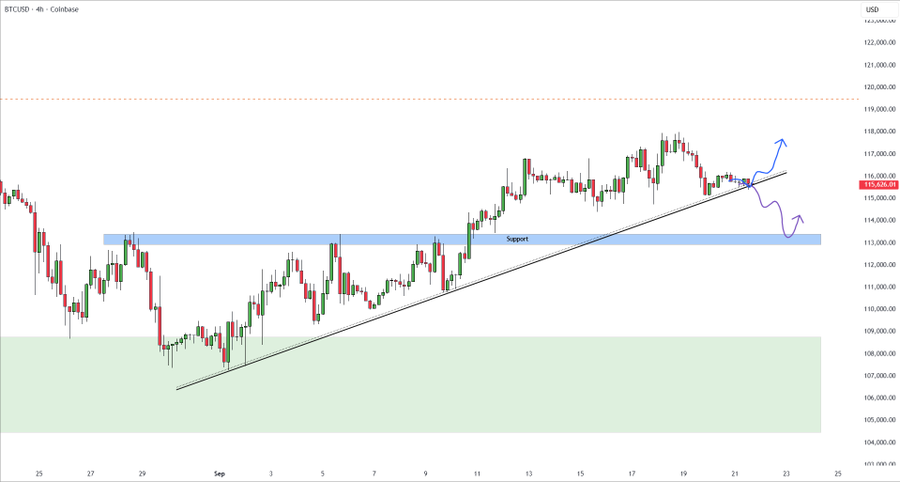
BTC/USD 4H Chart | Source: X
Market watchers are alert for signs of renewed buying. Even modest inflows from spot traders or long-term holders could help Bitcoin climb back toward the $117,000 to $118,000 resistance band. A successful defense of current support could also re-establish the ascending trendline as a springboard for another advance.
Market Sentiment Remains Mixed
At the same time, the broader crypto market is showing cautious behavior as traders weigh these competing signals. Some prefer to wait for a confirmed breakout or breakdown, avoiding premature entries. Others see the pullback as a buying opportunity if long-term fundamentals remain intact.
Technical traders agree that the $110,500 area is a key battleground. A decisive 4-hour close below this level could open the door to lower zones, while a rebound would suggest that bulls still hold control. Until price action provides clarity, Bitcoin remains at a pivotal point with near-term direction uncertain.
Get 3 Free Stock Ebooks
Discover top-performing stocks in AI, Crypto, and Technology with expert analysis.
- Top 10 AI Stocks - Leading AI companies
- Top 10 Crypto Stocks - Blockchain leaders
- Top 10 Tech Stocks - Tech giants


