

TLDR
- Dogecoin dominance broke a multi-year downtrend, suggesting renewed long-term market strength.
- A double top near $0.30 signals a potential price reversal and lower short-term momentum.
- Bearish retest below $0.267 projects a near-term downside target around $0.238.
- Sustained closes above the breakout trendline are critical to maintain the broader uptrend..
Dogecoin is showing conflicting technical signals as its market-cap dominance strengthens while its price chart warns of a possible correction. A long-term breakout in dominance suggests fresh market interest, but a double top formation on the daily chart projects a pullback toward $0.238. These patterns create a complex backdrop for traders weighing long-term strength against near-term risks.
Dogecoin Market-Cap Dominance Shows Uptrend
Dogecoin’s market-cap dominance recently broke a descending trendline that had capped growth since early 2021. Multiple failed attempts to reclaim this line ended when buyers finally pushed through, signaling a shift in long-term momentum. A bullish pin bar on the retest confirmed strong buying interest and validated the breakout.
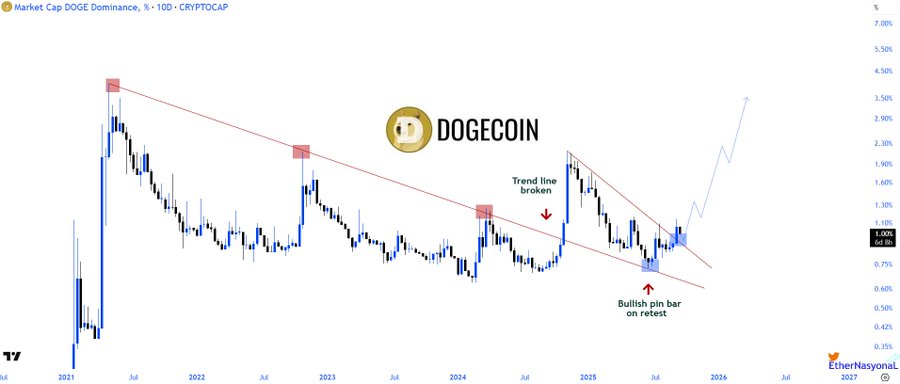
DOGE MCD 10D Chart | Source: X
This breakout has produced a series of higher highs and higher lows, often seen as the start of a durable uptrend. Increasing volume supports this move, reflecting fresh capital flowing into Dogecoin relative to the broader crypto market. If the structure holds, the dominance chart points to a gradual climb through mid-2025 and possibly beyond, provided the trendline holds as support.
Price Structure Warns of Double Top
Furthermore, on the daily price chart, Dogecoin faces a different setup. A double top pattern has formed around the $0.29 to $0.30 region, often signaling trend exhaustion. After a strong early September rally, price failed to break above the first peak and retested the same resistance level, suggesting sellers are actively defending the area.
DOGE/USD 1D Chart | Source: X

The neckline near $0.265 to $0.267 has already been breached, with a subsequent bearish retest confirming the flip from support to resistance. Based on the measured move of this pattern, analysts estimate a downside target near $0.238. This zone coincides with previous consolidation areas and could be where buyers look to re-enter.
Momentum Indicators Support Caution
In addition, momentum tools, including volume and relative strength metrics, appear to back the bearish case. Declining volume and softening relative strength indicate fading bullish conviction. If daily closes stay below $0.26, the likelihood of a deeper pullback grows stronger.
Still, markets rarely move in straight lines. Oversold conditions may spark temporary rebounds, and a decisive close above $0.27 would weaken the bearish thesis. Such a recovery would be an early sign that bulls are regaining short-term control.
Long-Term Outlook Remains Constructive
Even so, despite near-term risks, Dogecoin’s broader dominance breakout keeps the longer-term outlook constructive. Sustained closes above the broken trendline would confirm the continuation of the new market-cap uptrend. Such strength could offset short-lived price dips and keep the long-range bullish path intact.
Get 3 Free Stock Ebooks
Discover top-performing stocks in AI, Crypto, and Technology with expert analysis.
- Top 10 AI Stocks - Leading AI companies
- Top 10 Crypto Stocks - Blockchain leaders
- Top 10 Tech Stocks - Tech giants


