

TLDR
- XRP declined 1.71% to $2.20 while daily trading volume dropped 16.44% to just over $2 billion
- Token has traded sideways for 190 days between $2.00 and $2.60 following January’s $3.40 peak
- Market analysts suggest extended consolidation phases often precede major price movements
- Critical resistance level at $2.30 could unlock moves toward $2.50, $2.65, and $3.00
- Long-term Elliott Wave analysis points to potential targets between $25 and $40
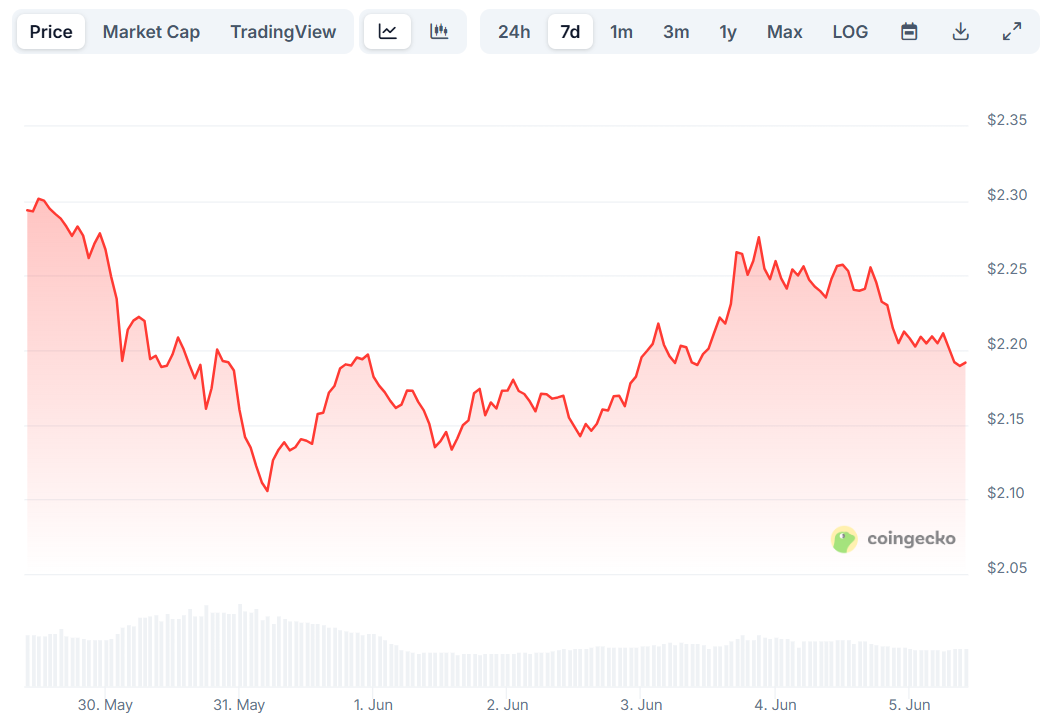
XRP closed Thursday’s trading session at $2.20, representing a 1.71% decrease from the previous day’s $2.23 level. Trading activity declined alongside the price, with daily volume falling 16.44% to $2,005,817,656.97.
The simultaneous drop in price and volume indicates shifting market dynamics. Despite the daily decline, XRP maintains a weekly gain of 3.88% and holds a market capitalization of $129,048,168,061.66.
Market observers note XRP has remained trapped in a trading range for approximately 190 days. The token continues moving between $2.00 on the downside and $2.60 on the upside.
This sideways price action began after XRP’s January rally peaked at $3.40. The token has since struggled to break free from this consolidation pattern.
Technical analyst Sjuu points out that XRP recently found support near $2.10, demonstrating some buying interest at lower levels. Yet resistance zones around $2.60 and $2.90 continue blocking upward progress.
The token touched $2.08 on May 31 before recovering toward $2.28. Current levels around $2.18 show the ongoing battle between buyers and sellers.

Market Dynamics and Technical Patterns
Professional traders often view extended consolidation periods as accumulation phases. These sideways movements can build energy for eventual directional breakouts.
XRP’s current pattern mirrors its previous seven-year consolidation that ended with a 6X rally from November 2024 through January 2025. This historical precedent suggests patience may reward current holders.
Will $XRP ever get out of this never-ending range?
Already trading here for 190 days! Seems like ages!
Well, just remember, the longer the consolidation, the stronger the breakout! pic.twitter.com/c6RRccj0vv
— Sjuul | AltCryptoGems (@AltCryptoGems) June 4, 2025
Technical analyst EGRAG highlights $2.30 as the immediate hurdle XRP must clear. Breaking above this level with a three-day close could signal the end of consolidation.
Such a breakout would also need to reclaim the 21-day exponential moving average. Success could trigger a double bottom pattern confirmation.
The percentage move required to reach $2.30 amounts to roughly 7% from current levels. This relatively small gain could unlock much larger upside targets.
Price objectives following a $2.30 break include $2.50, $2.65, and eventually $3.00. These levels represent previous areas of interest on XRP’s chart.
#XRP – Projecting Wave 5 (Target Range: $20 – $66):
🟣A Detailed Elliot Wave Count Analysis #XRP:
My analysis is grounded in mathematical principles rather than speculative hype. Let me show you how the Elliott Wave Theory is forecasting #XRP $20-$66.🟣 Wave 1:
This initial… pic.twitter.com/D04IpqPIcp— EGRAG CRYPTO (@egragcrypto) March 1, 2025
Long-Term Projections and Wave Analysis
Support at $2.07 remains critical for maintaining bullish market structure. This floor has provided stability during recent weakness.
EGRAG’s wave analysis suggests XRP could surge 1,200% to reach $25 once momentum returns. This projection uses Elliott Wave theory as its foundation.
The Elliott Wave framework indicates XRP has finished its corrective second wave. The token may now be positioned to begin a third wave advance.
Wave three typically represents the strongest and longest portion of a bull market cycle. Historical patterns support this interpretation of current market structure.
XRP’s correction from January’s $3.40 high reached $1.60 before stabilizing above $2.00. This retracement fits expected wave two characteristics.
Analyst XForceGlobal offers an even more optimistic long-term view, targeting $40 for XRP. This represents a conservative estimate within their broader analysis framework.
Current bearish sentiment presents the main obstacle to upward movement. However, technical indicators suggest this could change as consolidation matures.
Market participants continue monitoring key levels for signs of directional resolution. The extended sideways action has tested the patience of both bulls and bears.
Get 3 Free Stock Ebooks
Discover top-performing stocks in AI, Crypto, and Technology with expert analysis.
- Top 10 AI Stocks - Leading AI companies
- Top 10 Crypto Stocks - Blockchain leaders
- Top 10 Tech Stocks - Tech giants


