
 Price: Large Investors Position for Potential Move to $4,000")
TLDR
- Ethereum price dropped from $2,620 resistance and is trading below $2,600 with support at $2,470
- Whale activity on Binance has increased, with average order size reaching levels last seen in December 2023
- The same on-chain signal that preceded ETH’s 80% rally from $2,200 to $4,000 has appeared again
- Technical indicators show ETH broke above a bearish trend line but faces resistance at $2,600
- Current price stands at $2,537, up 0.5% in the past 24 hours
Ethereum price has experienced a fresh decline from the $2,620 resistance zone over recent trading sessions. The second-largest cryptocurrency is currently trading at approximately $2,537, representing a 0.5% increase over the past 24 hours.
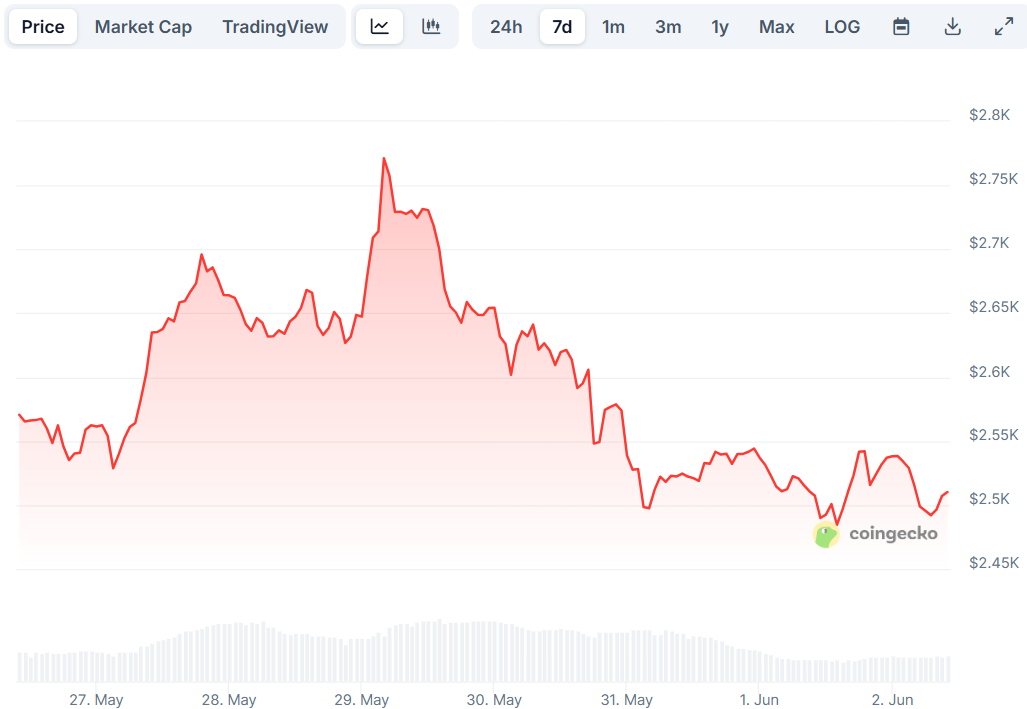
The recent price action saw ETH drop below the $2,600 level and test support at $2,470. This decline came after the cryptocurrency failed to maintain momentum above the $2,650 zone.
ETH broke below the 100-hourly Simple Moving Average during the selloff. The price also declined through the $2,550 level before finding temporary support.
A key development occurred when the price broke above a bearish trend line with resistance at $2,500. This technical breakout provided some relief for traders watching the downward momentum.
The current price level represents a test of the 23.6% Fibonacci retracement level. This retracement is measured from the swing high of $2,787 down to the recent low of $2,470.
On-Chain Signals Point to Institutional Interest
Market analyst Darkfost identified an important on-chain metric that historically preceded major price movements. The Average Order Size on Binance has reached levels similar to those seen in December 2023.

🔥 Ethereum whales are back on Binance !
This chart gives an instant snapshot of Ethereum’s sentiment and momentum on Binance, combining key market data on spot and futures activity, cumulative volumes, with moving averages comparison.
📊 In short, it’s an all-in-one signal,… pic.twitter.com/YCdaQJjDzd
— Darkfost (@Darkfost_Coc) May 31, 2025
This indicator divides total trading volume by the number of trades on the exchange. Higher values suggest institutional or whale participation rather than retail trading activity.
The December 2023 signal preceded ETH’s rally from $2,200 to $4,000, representing an 80% price increase. The current pattern shows whale orders returning to Binance since May 19.
Large investors typically position themselves early when broader trends show signs of strength. The current whale activity suggests institutional interest is returning to Ethereum.
The analyst noted that May might have provided a major entry window for large investors. This accumulation phase could set the stage for future price appreciation.
Technical Levels Define Trading Range
Current resistance levels sit at $2,550, $2,600, and $2,620 respectively. The $2,620 level corresponds to the 50% Fibonacci retracement of the recent decline.
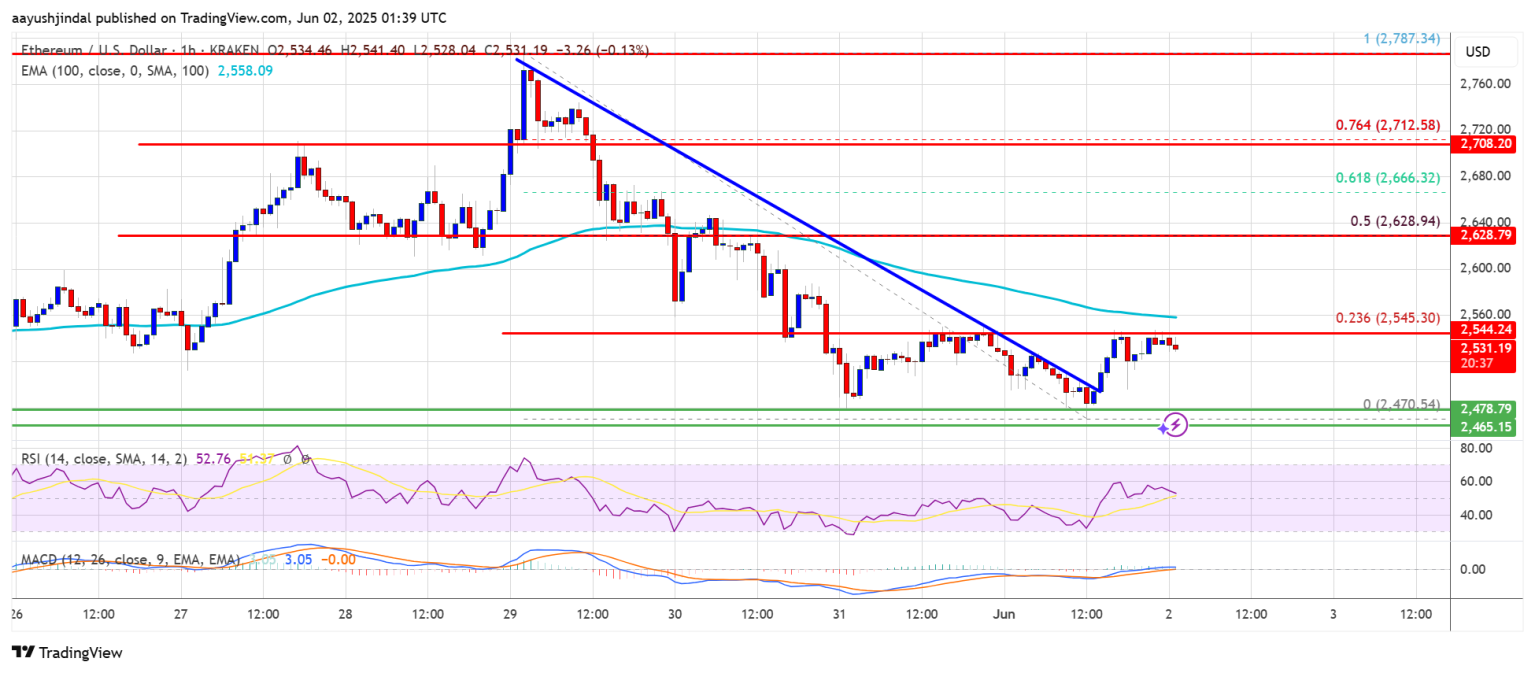
A clear break above $2,620 could send the price toward $2,720 resistance. Further upside momentum might target the $2,780 to $2,880 zone.
Support levels remain at $2,500 and $2,470 on the downside. A break below $2,470 could push ETH toward $2,420 support.
The hourly MACD indicator shows momentum in bearish territory. The RSI has moved below the 50 level, indicating ongoing selling pressure.
Additional downside targets include $2,350 and $2,320 if selling pressure continues. These levels represent key support zones from previous trading ranges.
ETH has struggled to maintain the $3,000 level since early February. The cryptocurrency has reached above $2,700 multiple times without sustained follow-through.
Get 3 Free Stock Ebooks
Discover top-performing stocks in AI, Crypto, and Technology with expert analysis.
- Top 10 AI Stocks - Leading AI companies
- Top 10 Crypto Stocks - Blockchain leaders
- Top 10 Tech Stocks - Tech giants


