
 Price: Two Bullish Chart Patterns Align for Potential Rally")
TLDR
- Dogecoin (DOGE) is forming an inverse head and shoulders pattern, a bullish technical setup that could signal trend reversal
- The key resistance level to watch is the neckline breakout, which would confirm the pattern and boost buying interest
- Price targets include $0.2390 and $0.2500 if the breakout occurs above the neckline resistance
- DOGE is testing the upper boundary of a descending channel that has controlled price action since December 2024
- A breakout above $0.27 would confirm the end of the downtrend and could trigger momentum toward $0.30 and higher levels
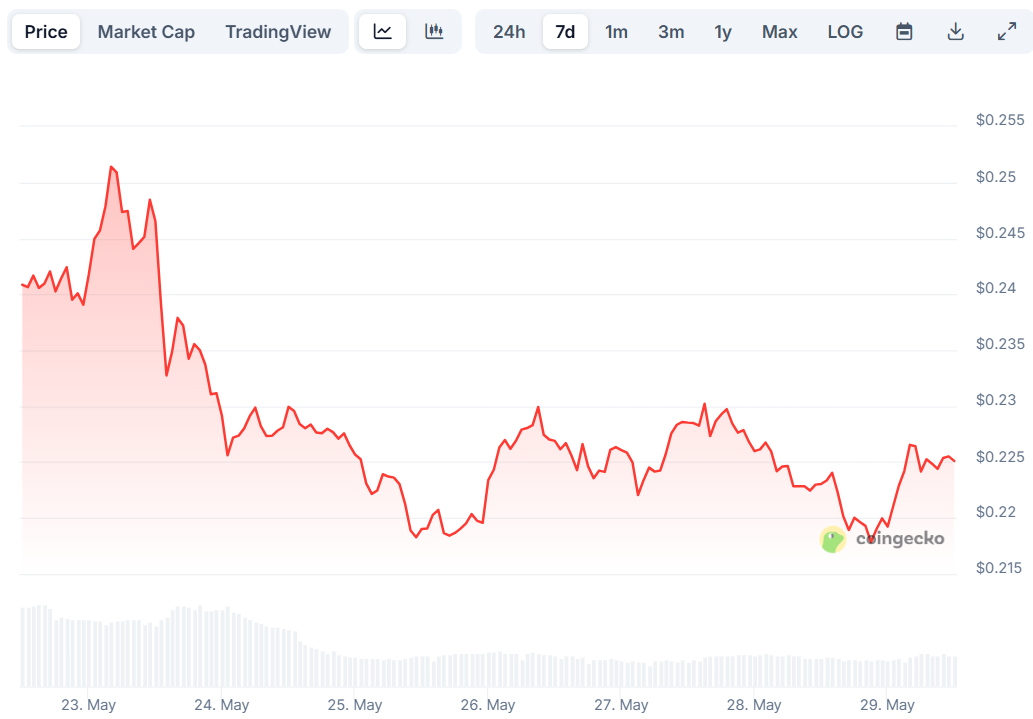
Dogecoin has been consolidating between $0.22 and $0.23 over the past 48 hours. The meme coin remains in recovery mode from its April low near $0.13.
Technical analysis reveals two important chart patterns developing on different timeframes. Both patterns suggest potential upward movement if key resistance levels are broken.
The first pattern is an inverse head and shoulders formation identified by analyst Klejdi Cuni. This bullish setup typically signals the end of a downtrend.
DOGE Poised To Resume The Bullish Trend – #DOGEUSDT @tradingview #bitcoin
Dogecoin is forming an inverse head and shoulders pattern, a classic signal of a possible trend reversal.In this case, it’s a short-term setup due to its smaller scale on the chart.
If the price breaks… pic.twitter.com/REI7F2WO3C
— KLEJDI CUNI (@TradingPuzzles) May 27, 2025
The pattern is considered short-term due to its smaller scale and limited timeframe. However, it still holds technical importance for price direction.
The critical level to monitor is the neckline resistance. A decisive break above this line would confirm the pattern validity.

Such a breakout could trigger renewed buying interest as momentum shifts toward the bulls. The confirmation would mark strength after recent consolidation.
Price Targets and Resistance Levels
If the inverse head and shoulders pattern confirms, two upside targets emerge. The first target sits at $0.2390, representing an immediate resistance zone.
The second target reaches $0.2500, which would mark a substantial recovery for DOGE. These levels reflect previous price action and technical resistance areas.
Volume and momentum indicators will play a crucial role in validating any breakout attempt. Traders should monitor these metrics closely as price approaches the neckline.
Descending Channel Analysis
On the daily timeframe, Dogecoin is testing the upper boundary of a descending channel. This channel has defined price action since December 2024.
The structure shows consistently lower highs and lower lows throughout this period. Recent activity indicates increasing bullish pressure at the resistance line.
Analyst MMBTrader notes that breaking this channel could trigger strong upward momentum. The initial target after a breakout would be the $0.30 price zone.
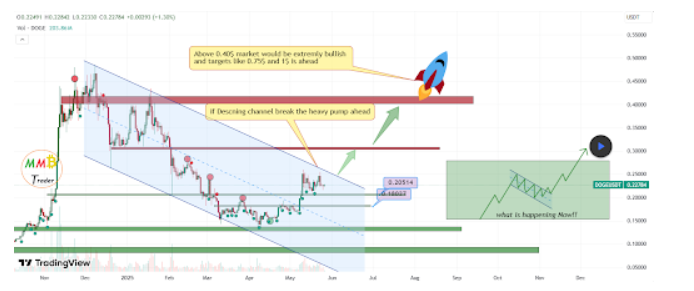
This level previously acted as major support between December 19, 2024, and January 2, 2025. It could now serve as resistance if price reaches that area.
The most important long-term level remains at $0.40 for new all-time highs. Breaking above $0.40 with momentum could confirm targets at $0.75 and $1.00.
A confirmed breakout above $0.27 would serve as the ultimate bullish signal. This level would invalidate the broader downtrend from the December 2024 high of $0.48.
If DOGE closes a daily candle above $0.27 with solid volume, it would mark a clean channel break. This would end months of consolidation and open the door for rapid upside.
Risk levels include support at $0.205 and $0.180 on any rejection from current resistance. A breakdown below these areas would delay the bullish setup.
At the time of writing, Dogecoin trades at $0.224, down 1.4% in the past 24 hours.
Get 3 Free Stock Ebooks
Discover top-performing stocks in AI, Crypto, and Technology with expert analysis.
- Top 10 AI Stocks - Leading AI companies
- Top 10 Crypto Stocks - Blockchain leaders
- Top 10 Tech Stocks - Tech giants


