


Key Takeaways
- Over the last 30 days, Solana has captured more than $900 million in net real-world asset inflows, surpassing major competitors
- Technical analyst Ali Martinez identified SOL’s first SuperTrend buy indication since mid-October, targeting $96 and $121 levels
- Robinhood Chain’s recent launch targets tokenized assets, though experts note distinct differences from Solana’s comprehensive ecosystem
- The $78 price barrier remains intact for SOL, while ETF data reveals $700K in outflows this week
- Blockchain metrics indicate increasing wallet activity as the 30-day moving average surpasses the 50-day threshold
Data from RWA.xyz reveals that Solana has attracted over $900 million in net real-world asset capital inflows throughout the previous month. This performance positions SOL at the forefront among major blockchain platforms during this timeframe.
Crypto Banter brought attention to these numbers, underscoring robust appetite for tokenized real-world assets within Solana’s infrastructure. The tokenization of traditional assets represents one of cryptocurrency’s most rapidly expanding sectors currently.
The network now maintains over $3 billion in real-world assets and has facilitated more than $10 billion in tokenized equity transactions. Its architecture supports decentralized financial services, stablecoin operations, payment systems, and consumer-facing applications within a unified Layer 1 framework.
Market analyst CryptosBatman offered his perspective on SOL’s chart dynamics via X, characterizing the token as appearing “very solid here.” He highlighted that the price has cleanly retested former resistance and successfully breached a bullish falling wedge formation, suggesting it “should continue higher from here.”
Robinhood Chain Makes Its Debut
Robinhood unveiled Robinhood Chain recently, a blockchain infrastructure designed specifically for tokenized equities and financial instruments. This development ignited discussions regarding potential competition with Solana.

Solana Daily clarified that these platforms serve different purposes. Robinhood’s competitive advantage lies in its extensive retail investor network, whereas Solana offers a comprehensive public blockchain infrastructure featuring substantial on-chain liquidity and a vibrant developer ecosystem.
$78 Resistance Level Proves Challenging for SOL Price
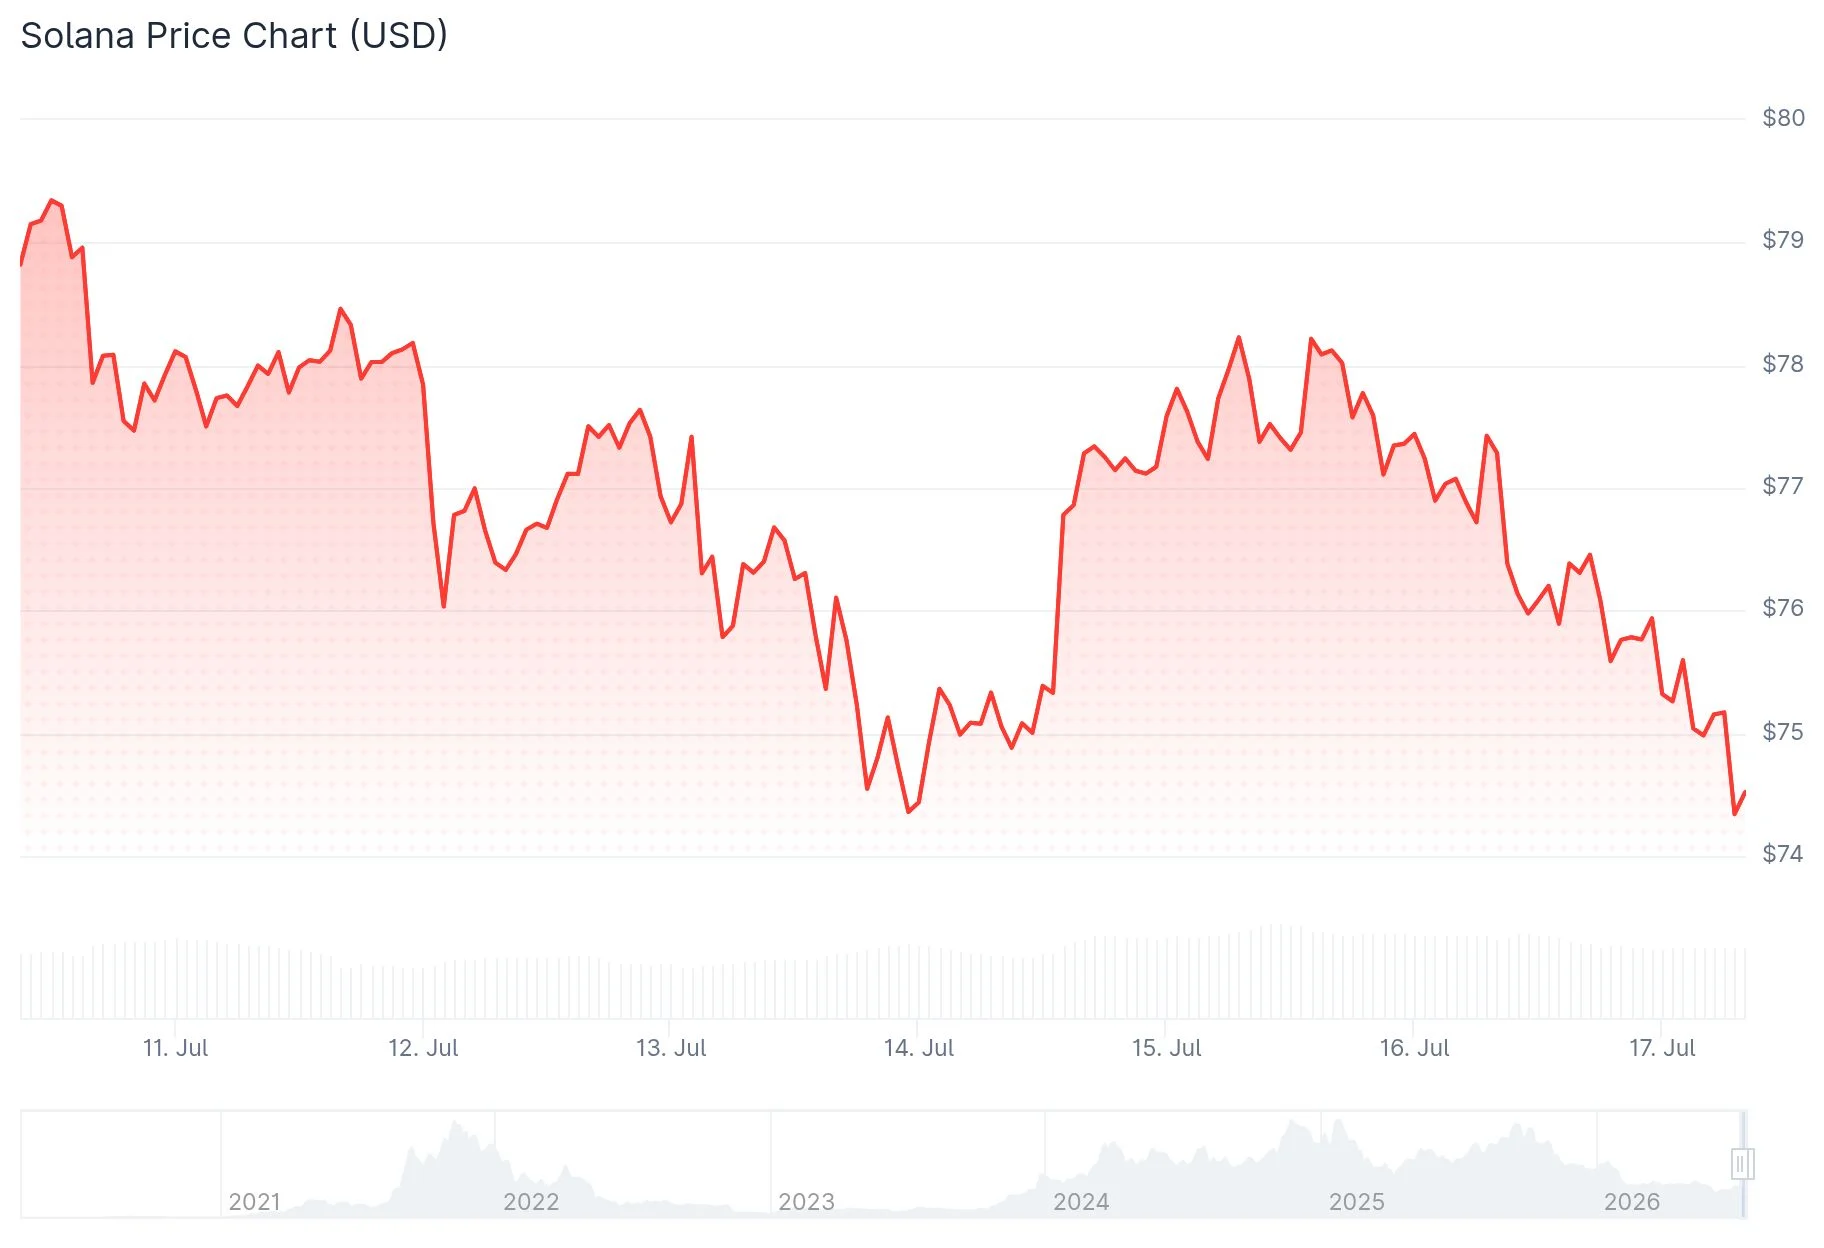
Despite positive RWA developments, SOL continues to encounter difficulty breaking through $78. The asset has declined approximately 2% over the last day, with trading volume declining from $4 billion on July 2 to roughly $2 billion currently.
Solana ETF activity has shifted into negative territory this week, recording $700,000 in outflows. This contrasts with the previous week’s inflows exceeding $1.1 million.
Market analyst Ali Martinez observed that the ATR trailing stop indicator has positioned itself beneath current market pricing—marking SOL’s first SuperTrend buy indication since October 10. He identified $96 as the immediate resistance target, with $121 as a secondary objective should momentum persist.
Santiment’s blockchain analytics demonstrate that the 30-day moving average for daily active addresses has intersected above the 50-day MA. The expanding distance between these indicators suggests accelerating wallet activation rates.
Critical trend line support exists at $74. A breakdown below this threshold could trigger a decline toward $64, according to market observers. Conversely, clearing $78 resistance may establish a pathway toward $90.
Get 3 Free Stock Ebooks
Discover top-performing stocks in AI, Crypto, and Technology with expert analysis.
- Top 10 AI Stocks - Leading AI companies
- Top 10 Crypto Stocks - Blockchain leaders
- Top 10 Tech Stocks - Tech giants



