



Key Takeaways
- Solana has shed 3% in Wednesday trading, approaching critical 50-day EMA support positioned at $76.67
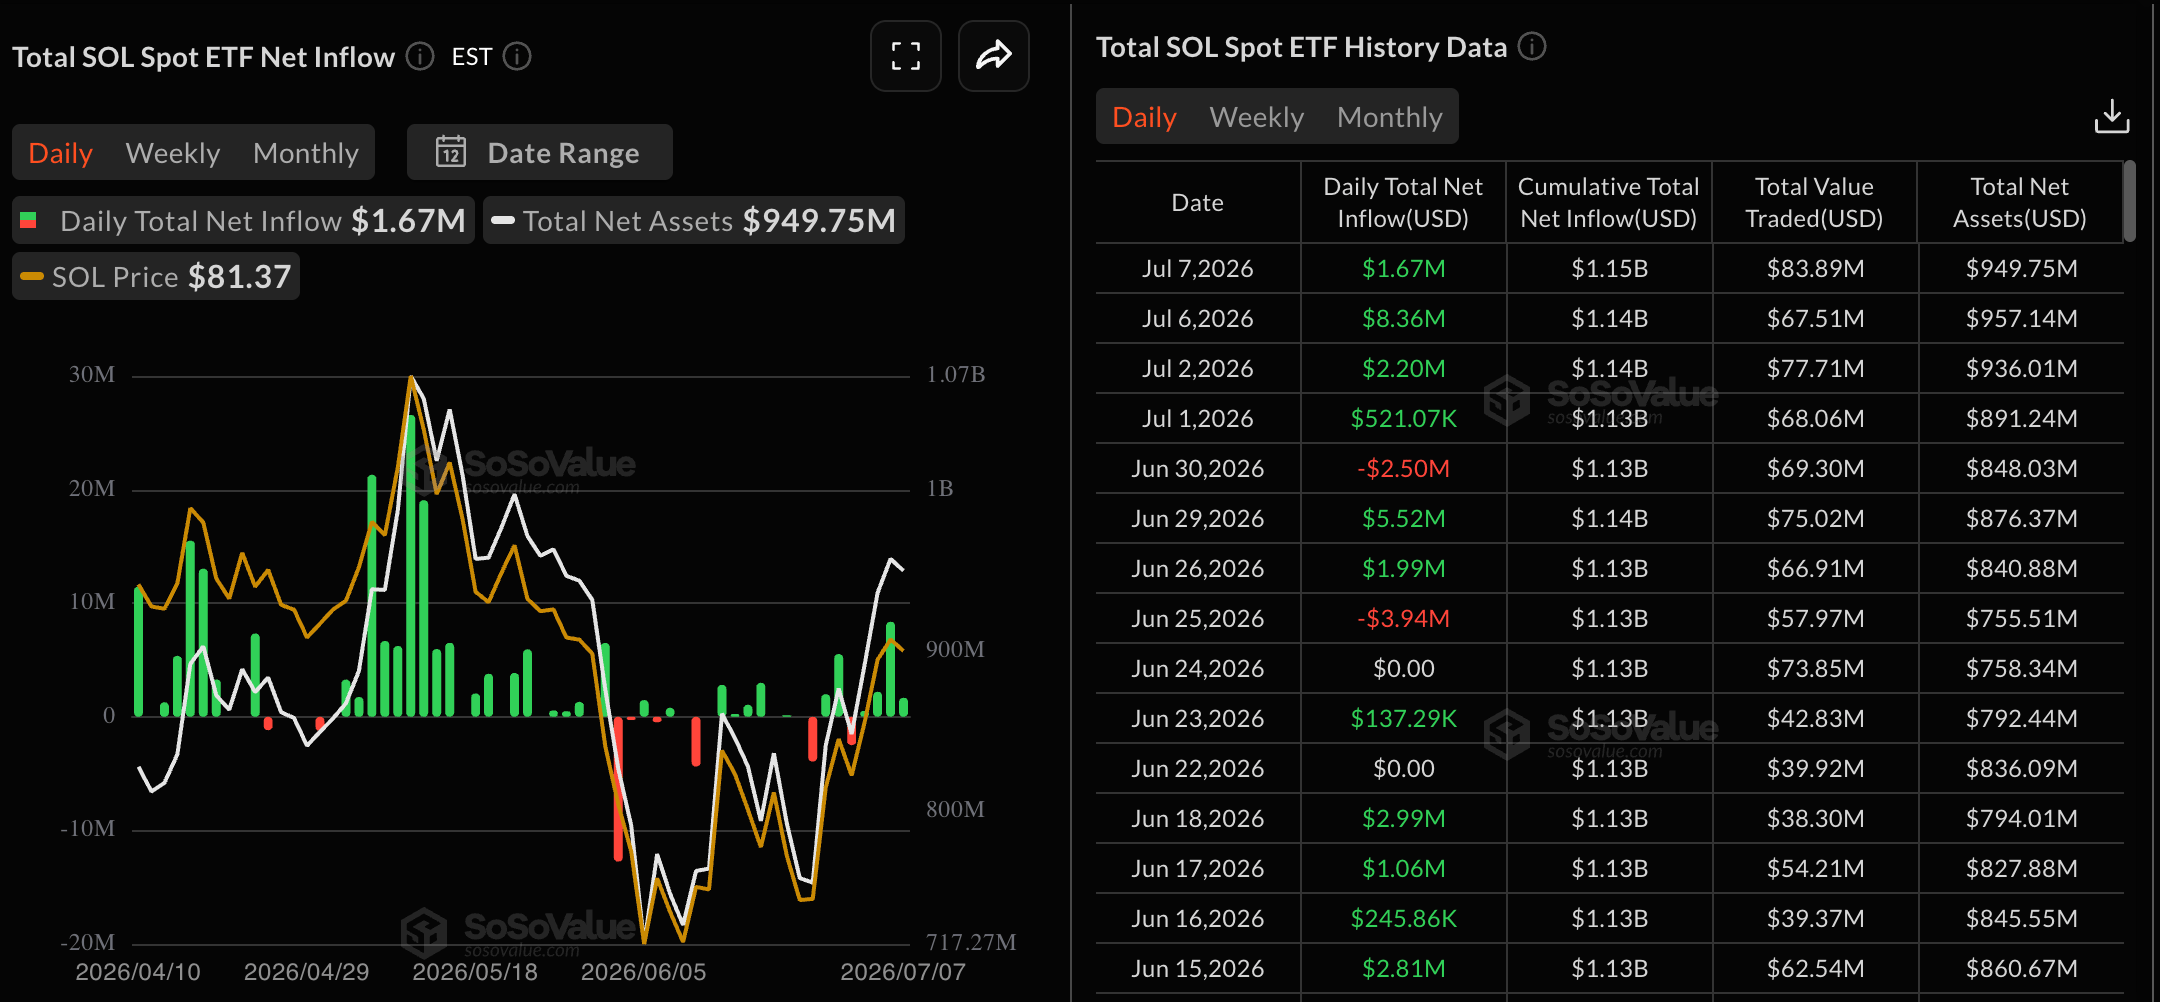
- ETF capital inflows plummeted to just $1.67M on Tuesday, representing a significant decline from Monday’s $8.36M
- Derivatives Open Interest contracted 4% over the past day to $5.31 billion, signaling diminished market participation
- Market analyst Ali Charts cautions that failure to break the $79–$85 resistance band could send SOL tumbling to $53
- Market observers Scient and Ryker are monitoring the $74–$77 range as a critical support base for potential accumulation
Solana (SOL) has retreated 3% during Wednesday’s session, continuing a downward trajectory that initiated following a rejection at long-standing overhead resistance near the $83.94 mark.
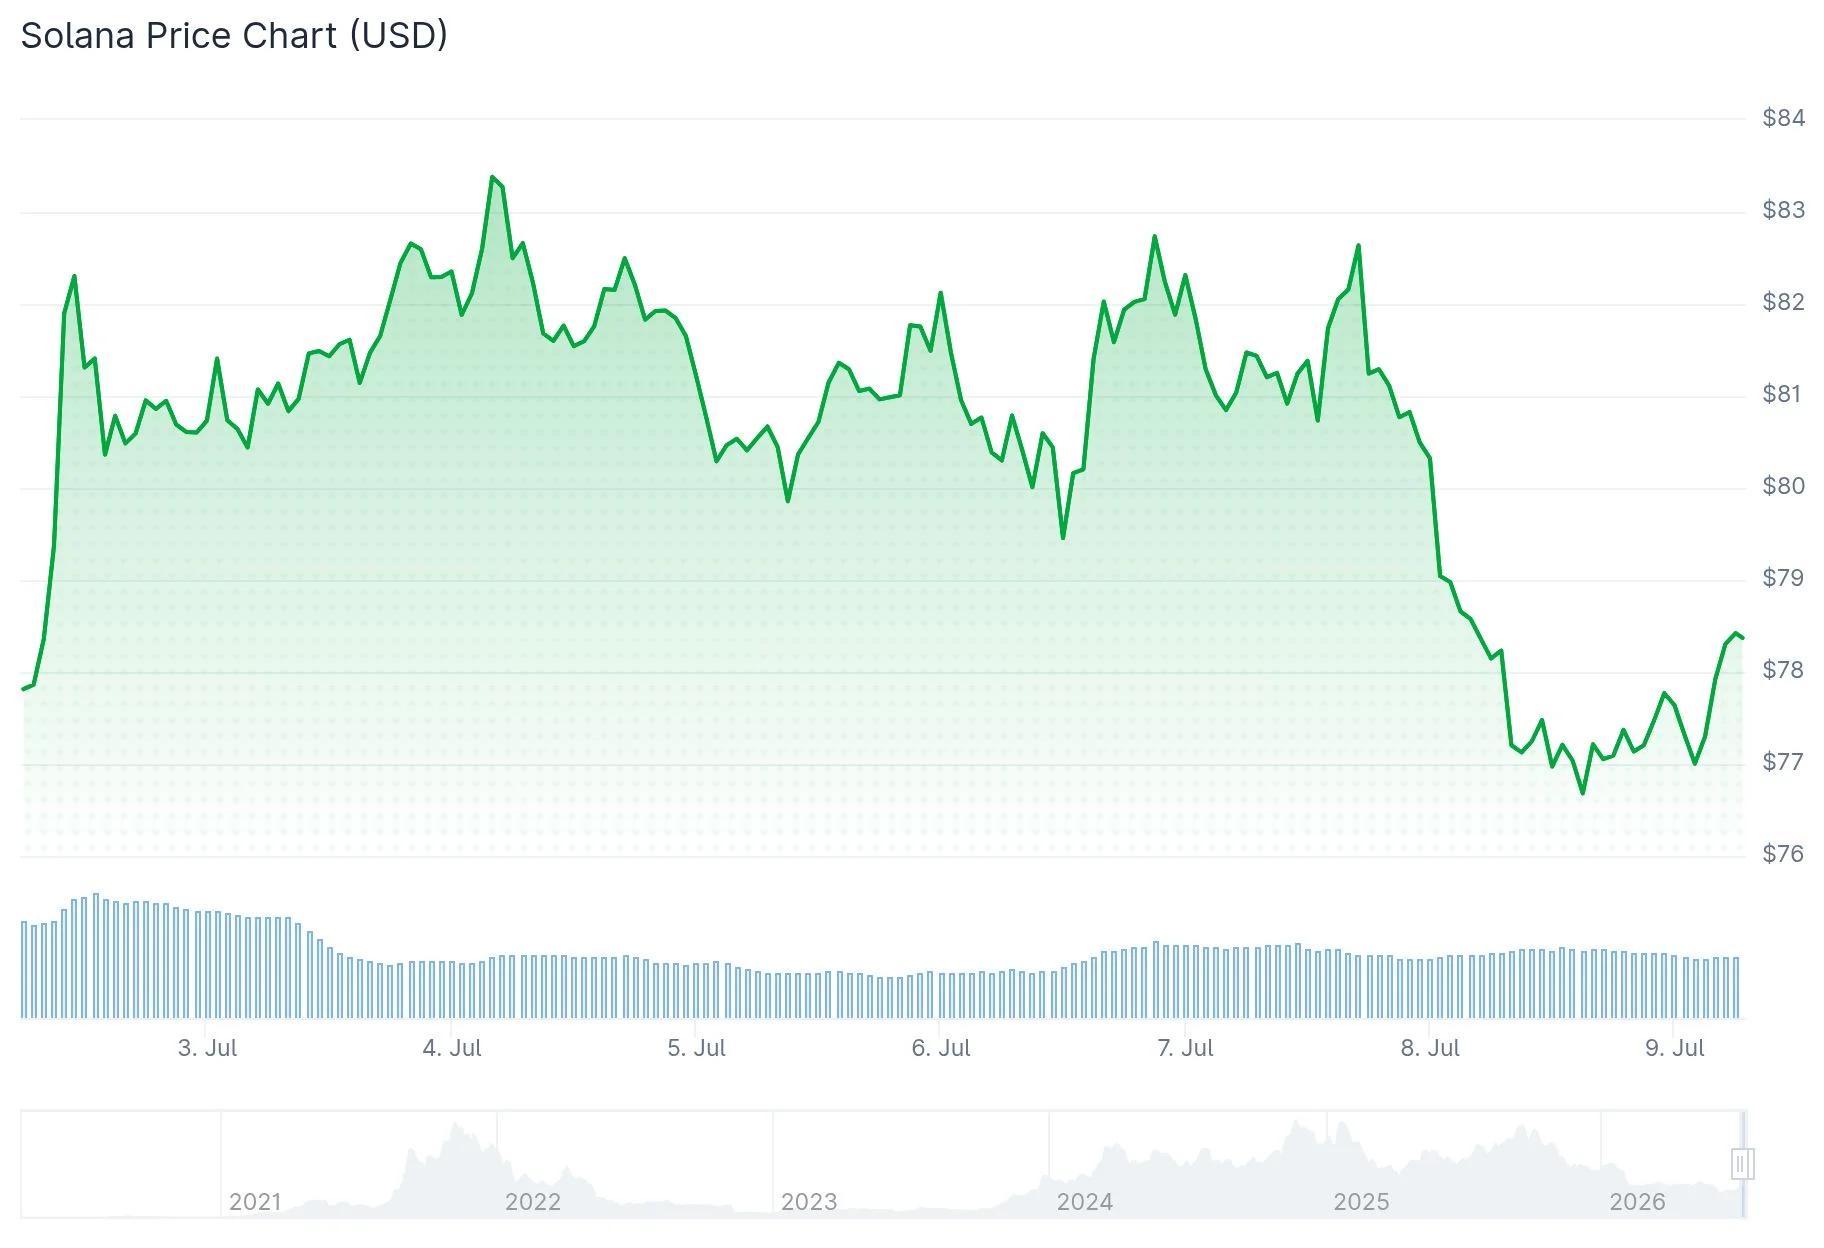
This downturn positions SOL dangerously close to a significant technical support boundary at $76.67, which coincides with the 50-day Exponential Moving Average (EMA).
Institutional appetite for SOL has notably weakened. Exchange-traded fund inflows registered merely $1.67 million on Tuesday, representing a dramatic decline from the previous day’s $8.36 million, per Sosovalue tracking data.
Derivatives Open Interest for SOL contracts declined 4% throughout the last 24-hour period to $5.31 billion, according to CoinGlass analytics. Concurrently, trading volume decreased 8% to $8.66 billion.
Funding rates currently register at 0.0029%, climbing from the prior day’s -0.0042%. This transition suggests market indecision among participants rather than conviction in either direction.

SOL continues trading substantially beneath the 200-day EMA positioned at $95.51. This configuration maintains the overarching trend in neutral territory rather than clearly bullish.
Bearish Momentum Builds Below $83.94 Resistance
The MACD indicator is declining toward its signal line, potentially establishing a bearish crossover should purchasing momentum continue deteriorating. The RSI has descended to 54, indicating that bulls are losing their grip on price action.
The most significant near-term support resides at the 50-day EMA of $76.67, which aligns closely with the 50% Fibonacci retracement level at $76.92. A definitive break below this critical zone would likely trigger further selling toward $60.13, representing approximately 22% downside.
Cryptocurrency analyst Ali Charts highlighted a substantial supply concentration between $79 and $85 via social platform X. Referencing on-chain URPD metrics he published, approximately 105 million SOL tokens were acquired within this price corridor.
He emphasized that successfully penetrating this resistance zone would unlock pathways toward $100 initially, followed by $127. However, rejection at these levels could intensify downward pressure, potentially driving SOL toward $53.
Market Participants Focus on $74–$77 Support Range
Trader Scient disclosed that he initiated accumulation in his SOL position following the pullback into the $74–$77 corridor. He characterized this region as a former breakout level and strategically placed limit orders extending down to $74.
Should buyers successfully defend this boundary, initial resistance emerges around $93. The broader bullish target zone spans between $115 and $127.
Trader Ryker is drawing parallels between the present 2026 structure and Solana’s 2023 consolidation phase, which preceded substantial upward momentum. He accumulated SOL at $40 during that market cycle and liquidated holdings at $122.
Ryker indicates he’s currently sidelined, awaiting more favorable entry conditions before reestablishing positions. He anticipates the technical setup requires additional development time before the next significant upward impulse materializes.
SOL exchange-traded fund inflows registered their lowest two-day reading at $1.67 million on Tuesday.
Get 3 Free Stock Ebooks
Discover top-performing stocks in AI, Crypto, and Technology with expert analysis.
- Top 10 AI Stocks - Leading AI companies
- Top 10 Crypto Stocks - Blockchain leaders
- Top 10 Tech Stocks - Tech giants



