
 Price Analysis: Can SOL Recover After Touching 3-Year Lows?")
TLDR
- SOL has recovered from the $60 support level and currently trades within the $64–$69 corridor, though it continues trading beneath critical moving averages
- Futures market signals remain pessimistic: the long-to-short ratio declined to 0.94 while funding rates shifted into negative territory
- Solana has recorded eight consecutive monthly losses, representing the longest bearish streak in its trading history
- Technical analyst BATMAN identified SOL locked within a symmetrical wedge pattern accompanied by bearish MACD divergence beneath the 200 EMA positioned near $74
- U.S.-based spot Solana ETF products registered $137,290 in net positive flows on Tuesday, indicating continued institutional participation
Solana has managed to defend the $60 threshold, though the subsequent rebound appears tentative. Currently hovering around $69, SOL remains constrained beneath important technical indicators and confronts multiple resistance barriers.
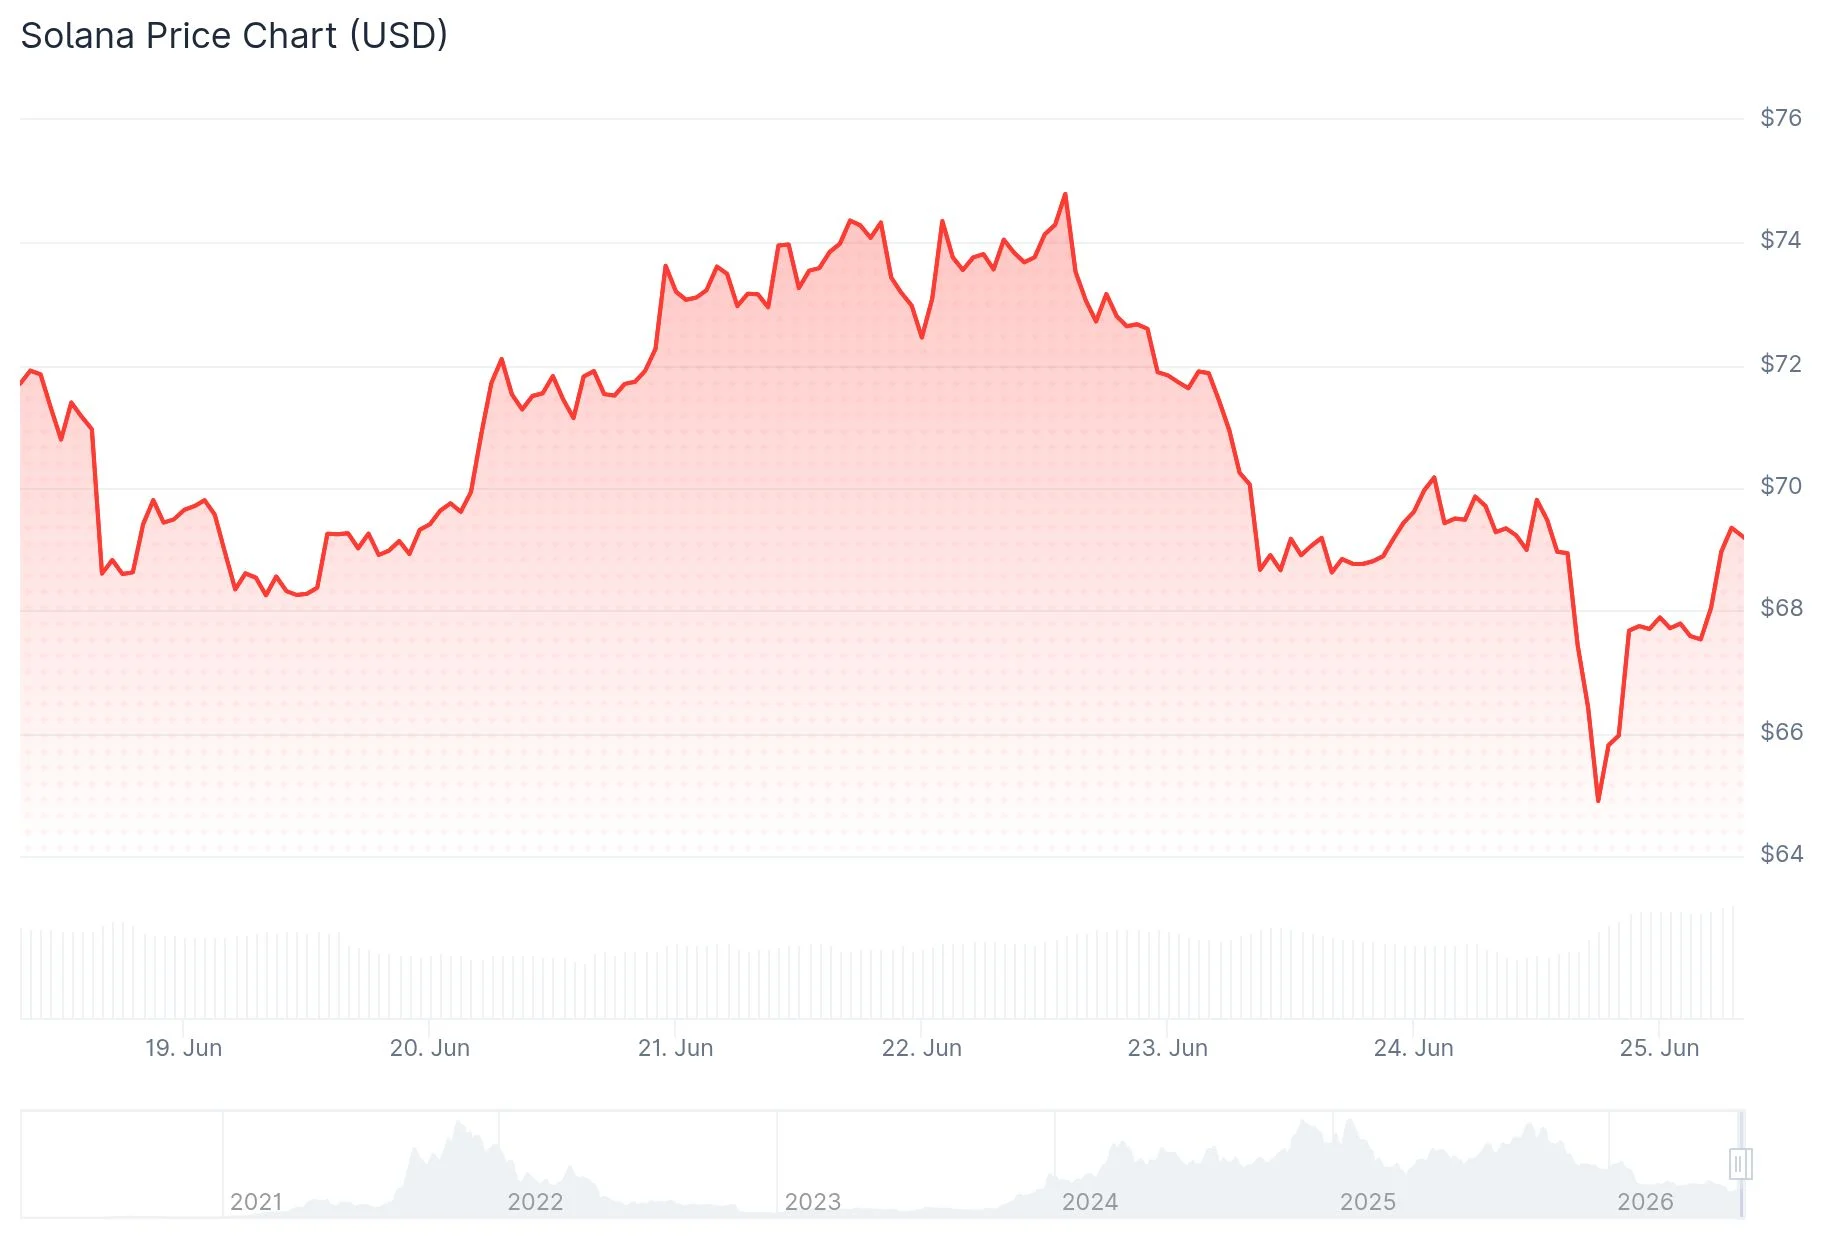
The $60 region has emerged as a critical psychological floor. Demand materialized at this level, driving SOL upward by more than 5% during a 24-hour period. However, supply pressure persists at higher price points.
Futures market indicators paint a concerning picture. According to CoinGlass data, Solana’s long-to-short ratio fell to 0.94 on Wednesday. When this metric drops below 1.0, it indicates short positions exceed long positions, reflecting pessimistic trader positioning.
Funding rates similarly turned negative during the early part of the week, registering -0.0080% on Wednesday. Negative funding rates mean short sellers are compensating long holders, a dynamic that generally suggests market participants anticipate continued downward price movement.
On June 24, cryptocurrency analyst BATMAN identified that SOL appears confined within an expansive symmetrical wedge formation on the chart. As volatility contracts toward the pattern’s convergence point, the price continues battling below the 200 EMA positioned near $74. The MACD indicator displays bearish divergence with diminishing momentum. BATMAN observed that Solana is “running out of room” and questioned whether SOL would break beneath the $69 level.

Critical Resistance Zones Ahead
SOL currently trades beneath its 50-day, 100-day, and 200-day exponential moving averages. These create a layered resistance structure that bulls must overcome.
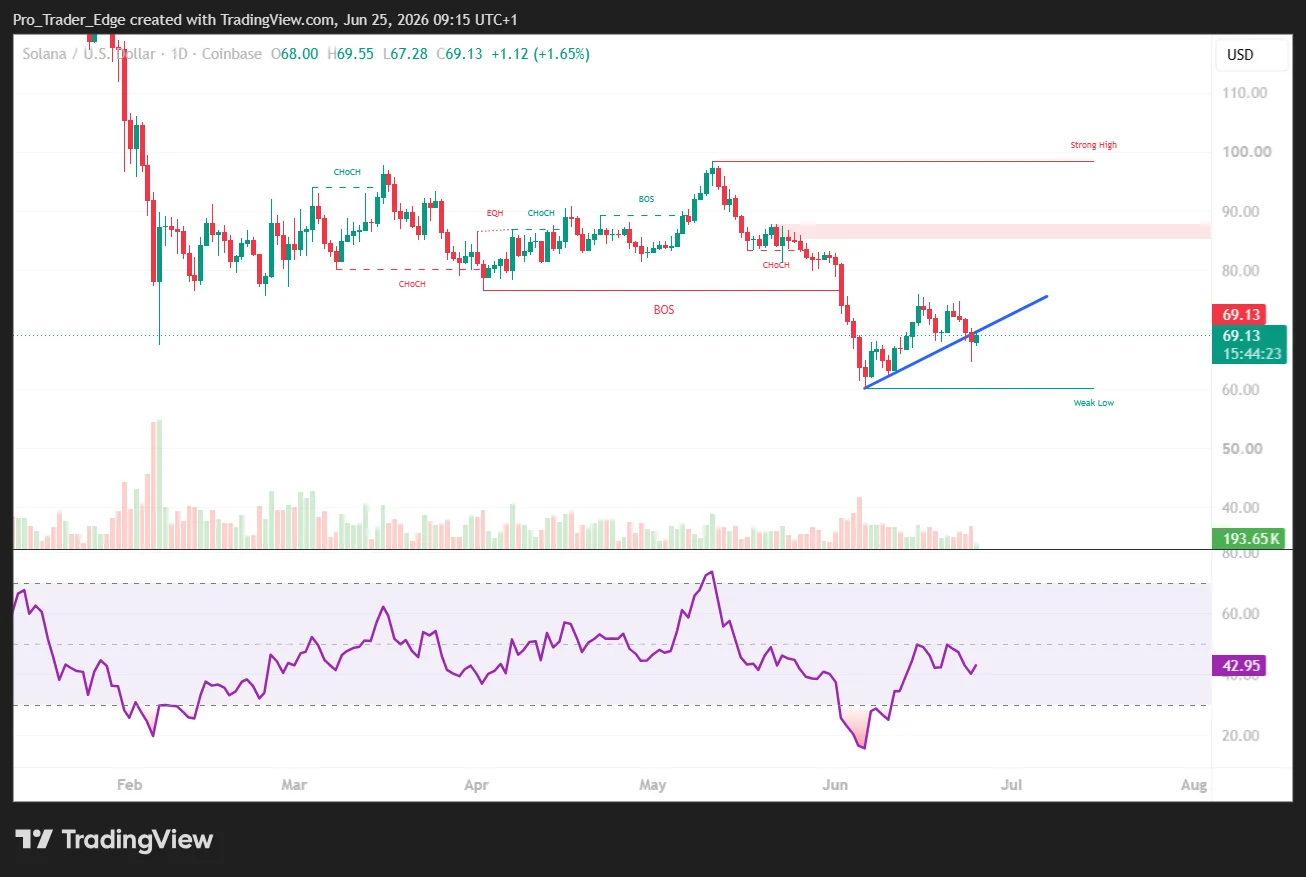
The initial obstacle sits around $74.75. Beyond that lies the 50-day EMA near $76.18. A more substantial advance could challenge the 50% Fibonacci retracement level at $79.27, followed by the 100-day EMA positioned at $83.03.
The MACD indicator on the 4-hour timeframe shows signs of flattening, while the RSI hovers near 46, remaining below the neutral 50 threshold. Neither technical indicator suggests an imminent powerful upward movement from present levels.
The monthly chart reveals an unprecedented situation. Analyst Ash Crypto highlighted that SOL has completed eight consecutive monthly declines, an unprecedented occurrence throughout its existence. The monthly RSI has reached deeper oversold territory than during the 2022 FTX crisis, when SOL plummeted to approximately $8.
Potential Positive Indicators
Not all data points toward further declines. Spot Solana ETF products reported $137,290 in net positive flows on Tuesday, based on SoSoValue data. While this represents a relatively small amount, it demonstrates ongoing institutional appetite.
Several market observers are monitoring the $50–$40 range as a possible accumulation territory. According to Rod’s technical assessment, if SOL establishes support within this zone, a longer-term advance toward $175 could materialize. Trader Symba’s SOL/BTC pair analysis identifies a significant long-term demand area in proximity, with projections eventually targeting new peaks above $300.
CryptoJack noted a trendline breakout on the 1-hour chart, suggesting near-term downward pressure may be weakening. Critical support levels to maintain are $62–$63, with resistance targets at $68, $70, and subsequently $76.
As of Wednesday, SOL’s long-to-short ratio remained at 0.94 with funding rates at -0.0080%, while the asset traded around $69.58.
Get 3 Free Stock Ebooks
Discover top-performing stocks in AI, Crypto, and Technology with expert analysis.
- Top 10 AI Stocks - Leading AI companies
- Top 10 Crypto Stocks - Blockchain leaders
- Top 10 Tech Stocks - Tech giants


