
 Bulls Face Critical Test at $78 as Price Slides to $69")
Key Takeaways
- Solana trades around $68–$69 following a 5–7% decline over 24 hours, hovering near crucial support levels
- Bulls face a make-or-break challenge at the $75–$78 resistance zone to prevent additional downside
- Major whale launched a 20x leveraged short on 554,680 SOL (approximately $38M) at $69, intensifying bearish sentiment
- Breaking below $60 could trigger a cascade toward the $40–$30 support range, according to market analysts
- Technical indicators like MACD suggest declining selling pressure, though recovery remains unconfirmed
Solana has experienced significant downward pressure throughout the past day, declining over 5% to settle in the $68–$69 range. The cryptocurrency is testing daily lows as bearish forces maintain control of near-term price action.
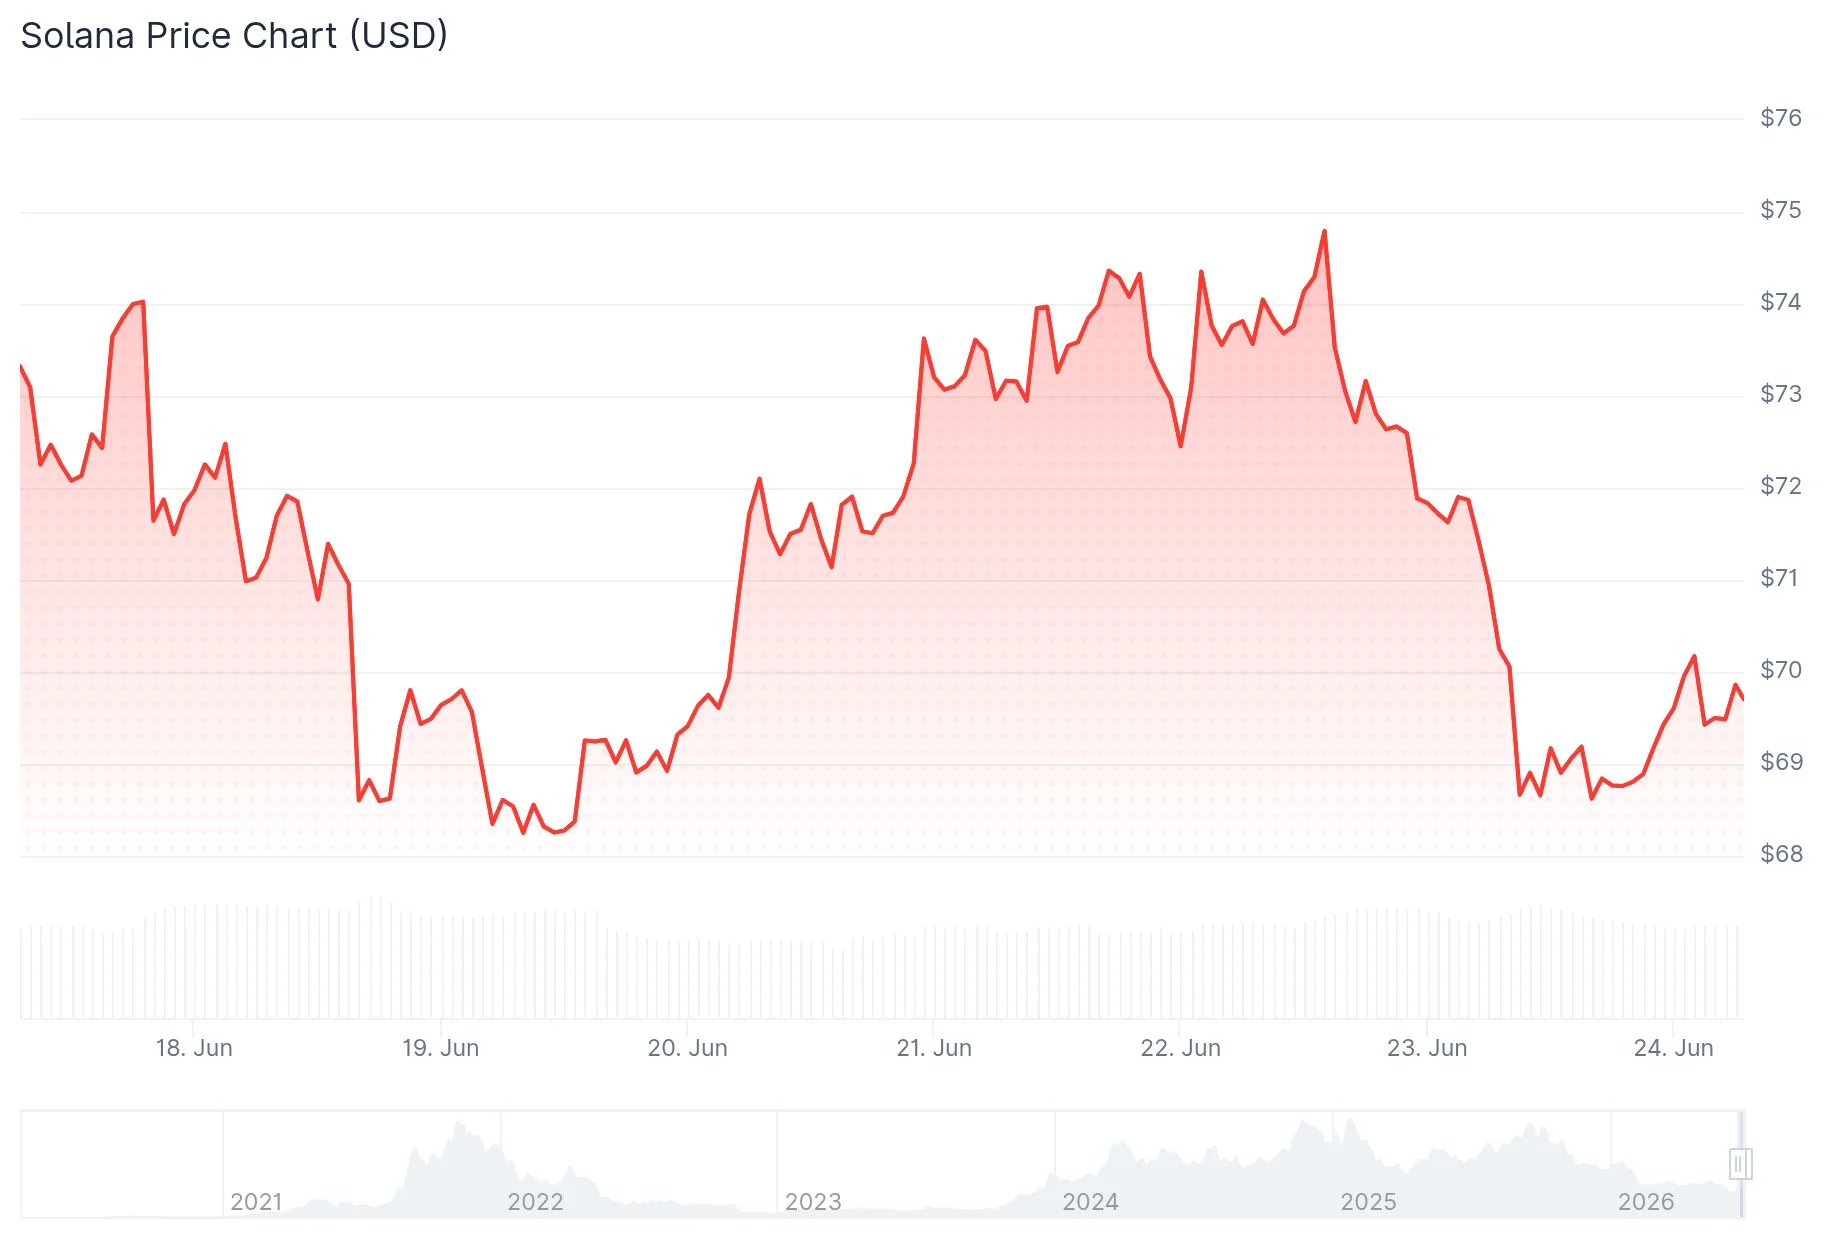
Current data shows SOL recording approximately $5.07 billion in 24-hour volume with a market capitalization near $39.92 billion. The intraday price action has established a range between $68.41 at the bottom and $72.80 at the peak.
Attempts to bounce above $70 earlier in the trading session proved unsuccessful, with sellers pushing the price back toward the lower boundary of the established range.
Large Trader Establishes Significant Bearish Position at $69
Blockchain analytics service Lookonchain identified a whale establishing a 20x leveraged short on 554,680 SOL tokens, representing roughly $38.15 million in value. The short was opened near $69.23, with the breakeven threshold sitting at approximately $69.19.
With current prices hovering near this entry zone, the position remains marginally profitable. Sustained trading below the $69–$70 level keeps this short position in positive territory, potentially suppressing bullish momentum.

Cryptocurrency analyst Sjuul from AltCryptoGems highlighted on June 22 that sellers maintain dominance over SOL’s price action, though buyers are mounting local defense attempts. He emphasized that reclaiming $78 represents the critical objective for bulls, identifying it as the catalyst for a “power of 3” expansion pattern—while cautioning traders against aggressive long entries until that threshold is secured.
Recapturing $70 followed by $72 would start alleviating bearish momentum, but until that materialized, trader attention remains fixed on downside targets at $68, $64, and $60.
Critical Resistance Zone Between $75–$78 Determines Next Move
Market observers are concentrating on the $75–$78 price band as the pivotal decision point. This area has been identified as the essential resistance level that will determine Solana’s immediate trajectory. Successfully breaking and maintaining above $78 would open pathways toward $85, with $90 emerging as the subsequent target.
Conversely, rejection at this critical zone would preserve the bearish framework. Failure to overcome this resistance could drive prices back toward the $64–$60 support area.
A breach below $60 would activate longer-term cycle projections pointing toward a support band spanning $55 to $40, where accumulation might emerge.
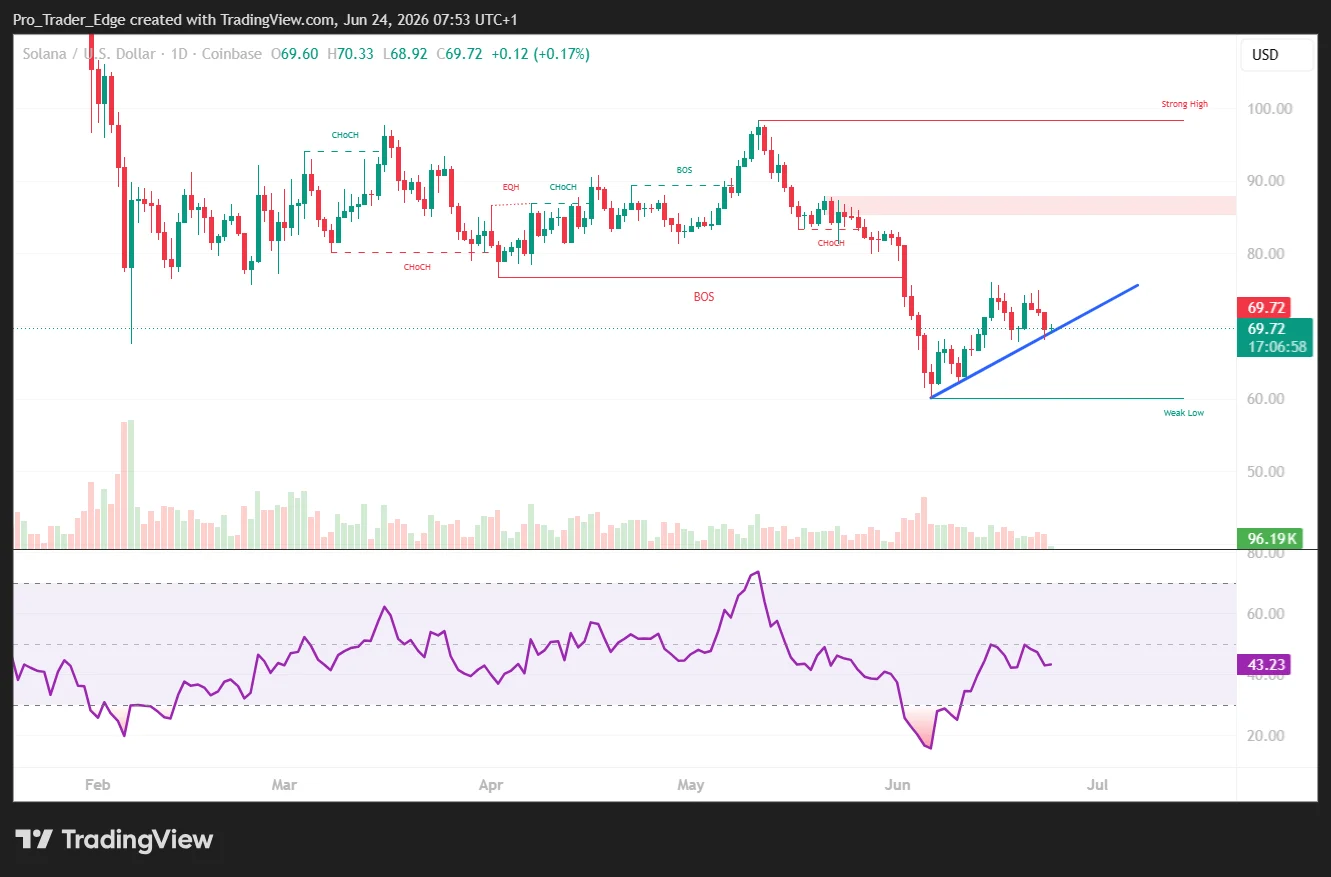
From a technical perspective, the MACD indicator shows a reading of -1.81 versus a signal line at -2.59, producing a histogram value of +0.79. These readings indicate potentially weakening downward momentum, though confirmation of reversal requires price action breaking above the middle Bollinger Band positioned near $68.72.
The upper Bollinger Band is located at $75.69, corresponding with the resistance zone highlighted by market analysts.
Solana has demonstrated a fragile trend structure since October 2025, with prices remaining beneath the broader $80–$90 reclaim area that would signal a healthier trend formation. Latest market data places SOL near $69, just underneath the $70 threshold that bulls must secure as an initial recovery step.
Get 3 Free Stock Ebooks
Discover top-performing stocks in AI, Crypto, and Technology with expert analysis.
- Top 10 AI Stocks - Leading AI companies
- Top 10 Crypto Stocks - Blockchain leaders
- Top 10 Tech Stocks - Tech giants


