
 Price Slides to $1,682 as Analyst Eyes $1,580 Target — Key Levels to Watch")
Key Takeaways
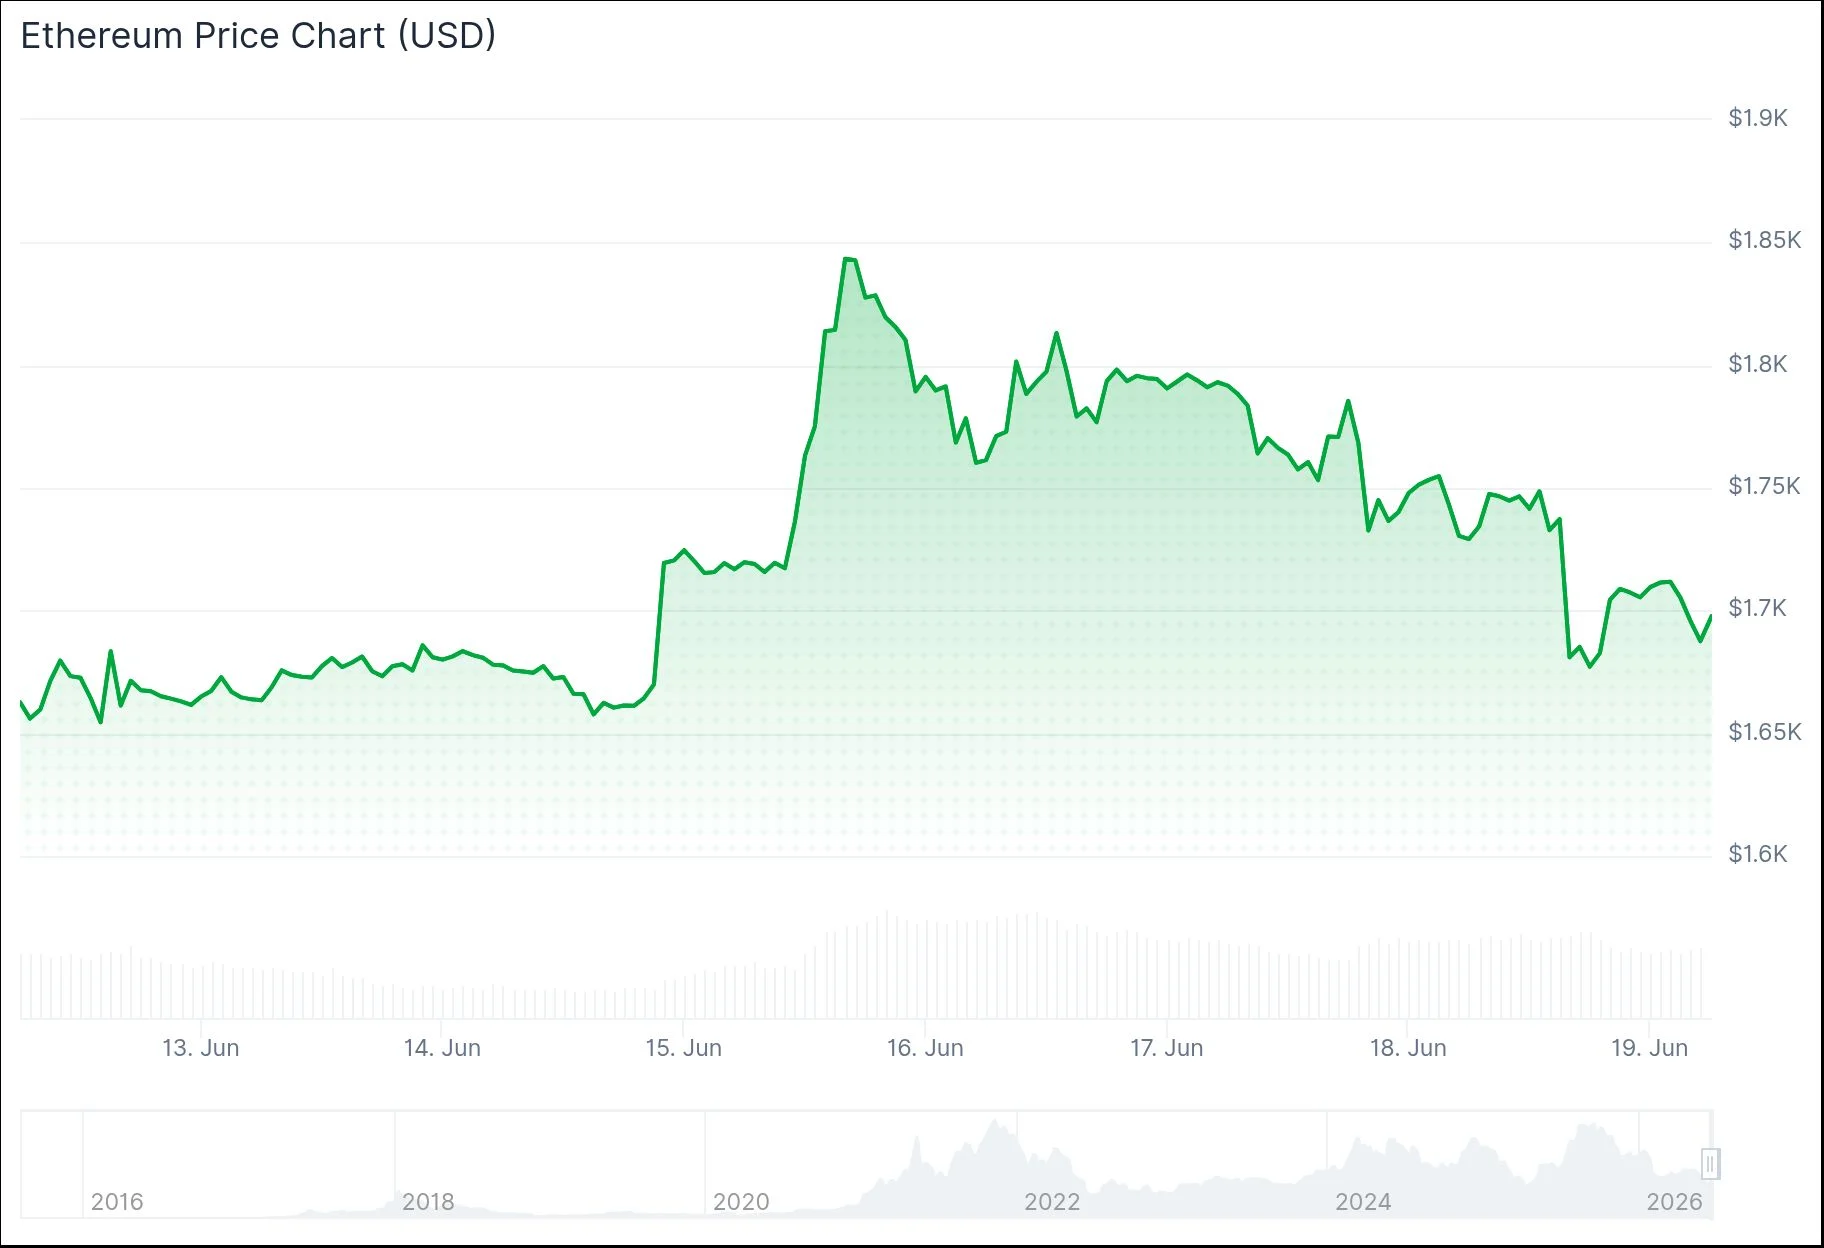
- Ethereum currently trades at approximately $1,682, experiencing a nearly 5% decline as it breaches crucial trendline support.
- Q1 2026 witnessed unprecedented network engagement with 13.2 million monthly active users and transaction volume exceeding 200.4 million.
- Tokenized commodity assets on the Ethereum blockchain surged 60% from the previous quarter, with Gold accounting for the majority of growth.
- Derivatives markets show declining activity, with options open interest plummeting from $8.5 billion peak to $5.5 billion currently.
- Price action remains confined between critical $1,500 floor and $1,920 ceiling as volatility continues to compress.
Ethereum has settled around the $1,682 price point following a sharp 5% decline within 24 hours. The digital asset has breached a significant upward trendline, with the next critical support zone positioned around $1,500.
Technical charts on the daily timeframe reveal volatility compression following June’s aggressive selloff. This consolidation mirrors price behavior observed prior to the previous major downward movement.
Prominent crypto analyst Ali Charts shared insights on X platform: “Ethereum $ETH is breaking down from its channel and is now trading below the 200-hour SMA. I’m expecting a move toward $1,580.” This projection corresponds with current bearish technical formations, as ETH remains constrained beneath the $1,750 resistance after a temporary rebound from the $1,500 base.
ETH has surrendered two critical support zones over recent trading sessions. The asset penetrated an upward-sloping trendline and the $2,150 threshold during mid-May, subsequently breaking through the $1,920 support before stabilizing near $1,500.
Following that bottom, ETH has recovered toward the lower boundary of a descending price channel approaching $1,750. This zone has transformed from previous support into current resistance.

Derivatives Markets and ETF Activity Indicate Muted Trading Sentiment
Open interest in Ethereum options contracts has contracted to approximately $5.5 billion across major exchanges, substantially below the $8.5 billion peaks recorded during January and March. Perpetual swap funding rates have likewise normalized around zero, indicating market equilibrium between buyers and sellers.

Reduced open interest combined with neutral funding dynamics indicates diminished leveraged positions across the market. When a significant catalyst emerges, price movements could accelerate rapidly with minimal friction in either direction.
Spot Ethereum ETF capital flows have demonstrated recent stabilization. Following extended periods of consistent withdrawals, June recorded several days showing modest positive inflows. While the volumes remain limited, this transition from net selling to cautious accumulation represents a notable shift in recent trend patterns.
Network Metrics Reach All-Time Highs in Q1 Amid Price Weakness
Notwithstanding price deterioration, Ethereum’s fundamental network metrics achieved impressive milestones during Q1 2026. Monthly active wallet addresses averaged an unprecedented 13.2 million, representing a 53.5% increase from the previous quarter. Total transaction volume climbed to 200.4 million, marking a 38% quarterly gain.
Network throughput achieved a record 25.78 transactions per second. Transaction fees, however, declined 47.9% quarter-over-quarter following implementation of the Fusaka upgrade in December, which significantly expanded data availability.
Tokenized commodity assets on the Ethereum blockchain expanded 60% quarter-over-quarter to $4.7 billion, with Gold-backed tokens driving nearly all growth. Ethereum commands an 84% market share of tokenized commodities among the top five blockchain networks.
ETH’s fully diluted market capitalization contracted to $290 billion during Q1, declining 30.3% from the prior quarter. The daily Relative Strength Index currently hovers near 38, suggesting weakening yet stabilizing bearish momentum.
Get 3 Free Stock Ebooks
Discover top-performing stocks in AI, Crypto, and Technology with expert analysis.
- Top 10 AI Stocks - Leading AI companies
- Top 10 Crypto Stocks - Blockchain leaders
- Top 10 Tech Stocks - Tech giants


