
 Price: Critical $1,700 Support Level Under Scrutiny as Resistance Builds")
Key Takeaways
- Open interest in Ethereum futures has declined by approximately 2 million ETH since the end of May.
- Funding rates continue oscillating between positive and negative territory, indicating limited trader conviction on either side.
- ETH remains confined within a narrow trading band between $1,741 and $1,806, facing resistance at the 20-day EMA around $1,794.
- US spot Ether ETFs recorded positive inflows once more, though volumes remained modest at $9.6 million on Tuesday.
- Market analyst Ted Pillows highlighted the $1,700 to $1,750 range as the critical support zone that must hold.
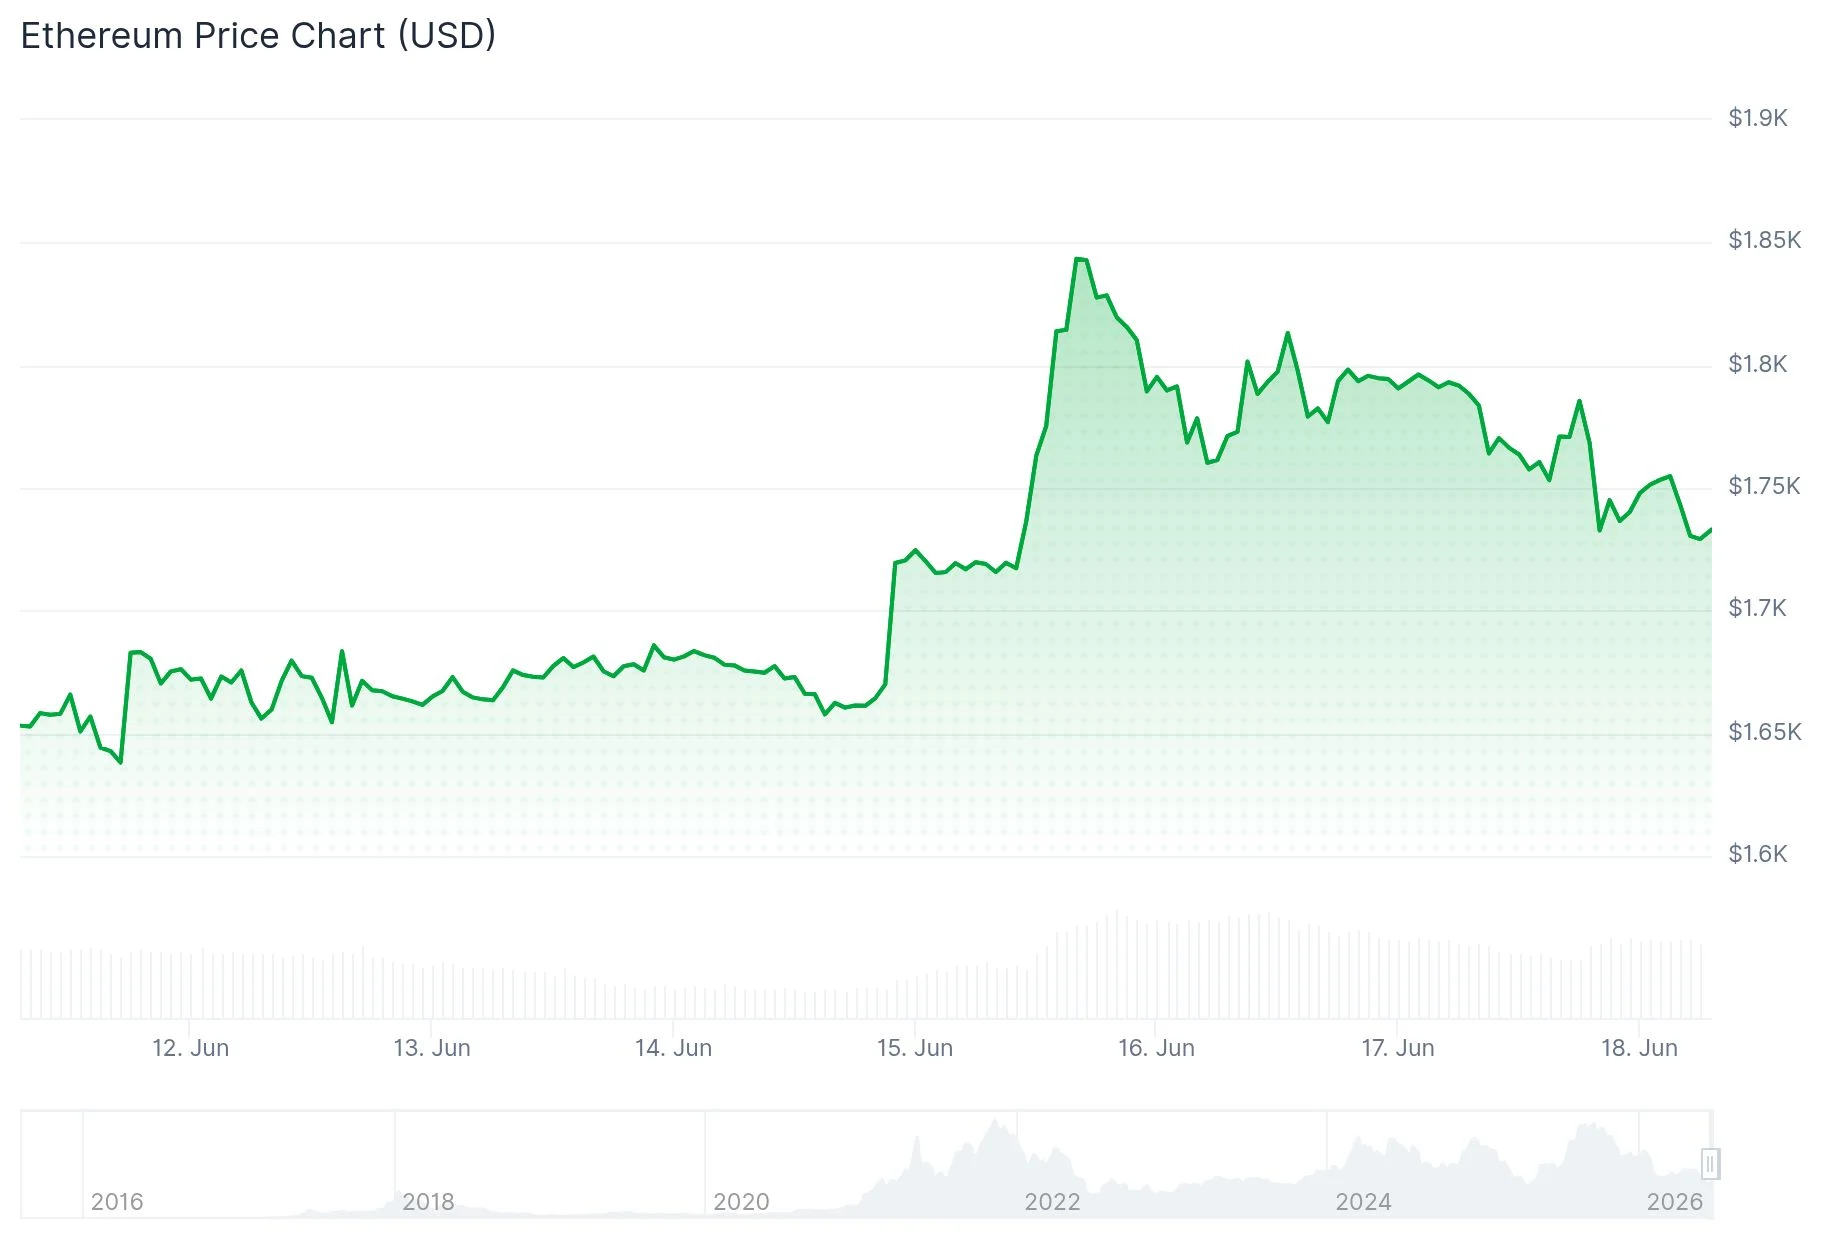
Ethereum (ETH) continues to hover around the $1,740 level as derivatives market activity remains subdued following the recent volatility reset. Current data reveals ongoing trader hesitation after ETH briefly tumbled below $1,600 earlier in the month.
Open interest across Ethereum futures contracts dropped to 13.64 million ETH by Sunday, marking the lowest point since the beginning of May. A modest rebound occurred following Monday’s price recovery above the $1,700 threshold.
The decline in futures open interest since May 28 totals roughly 2 million ETH, signaling reduced appetite for leveraged positions among derivative traders in the current environment.
Funding rate dynamics have also painted a picture of market indecision. Throughout the past fortnight, these rates have alternated between negative and positive values without establishing a clear trend.
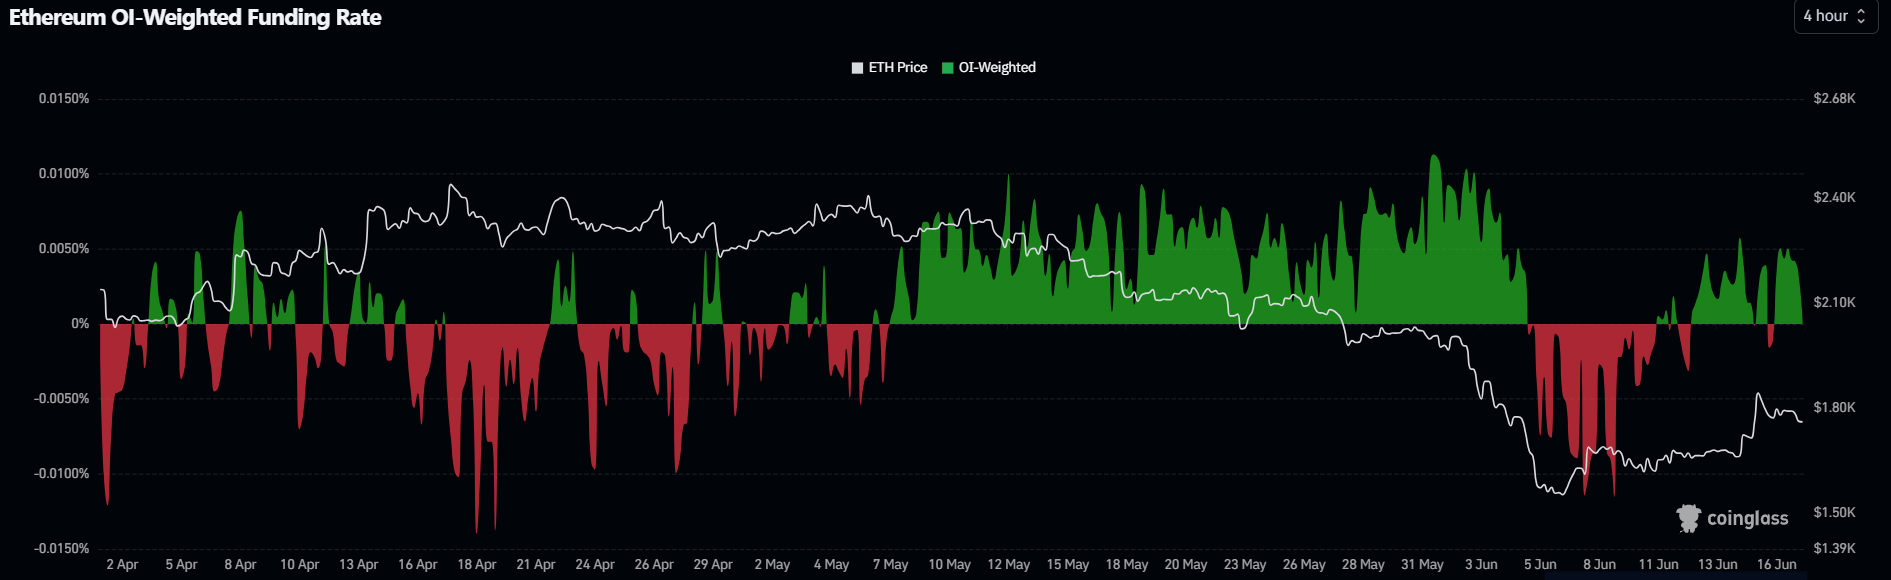
This oscillating behavior indicates that neither bullish nor bearish forces have gained decisive momentum. The pattern emerges following significant long position liquidations that swept through markets during the final days of May and the opening week of June.

Meanwhile, spot market activity shows exchange reserves experiencing a marginal decline over the last 48 hours. US-based spot Ethereum ETFs recorded their second consecutive day of net inflows, contributing $9.6 million on Tuesday.
Technical resistance levels remain nearby
Despite these marginally positive developments, the overall data landscape continues to reflect cautious sentiment. Neither retail participants nor institutional players have demonstrated a pronounced shift in positioning.
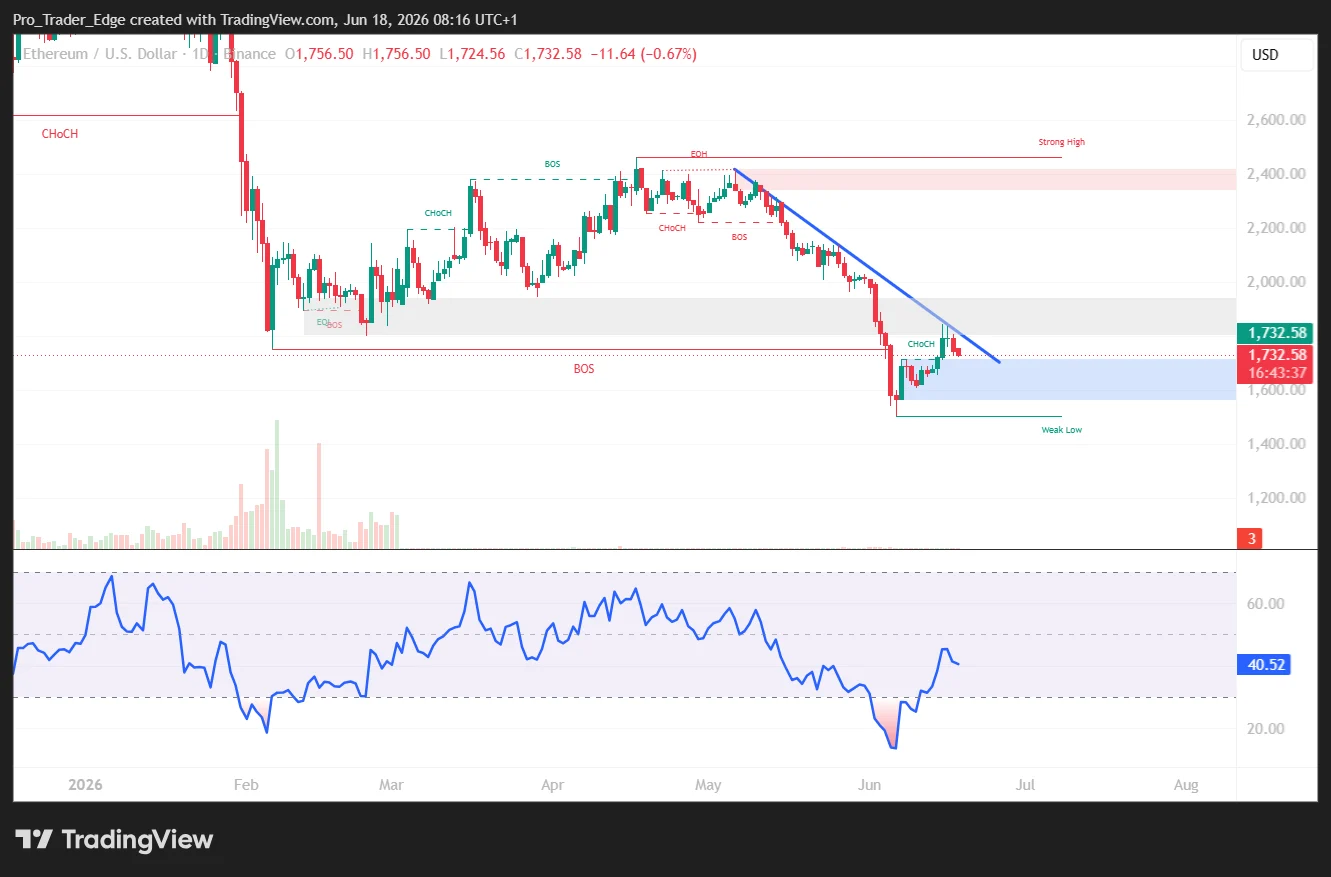
Technical analysis of the daily chart reveals ETH trading below its 20-day, 50-day, and 100-day exponential moving averages. These technical indicators form a resistance cluster spanning from approximately $1,794 up to $2,109.
The closest overhead obstacle sits at the 20-day EMA around $1,794. Should prices push through that level, the horizontal resistance at $1,806 becomes the next barrier to monitor.
A sustained breakout above current levels would bring additional resistance zones at $1,909, $1,955, and $2,019 into play. The 100-day EMA positioned near $2,108 represents a more significant ceiling that could cap upside momentum.
Critical support zone draws market attention
Looking at potential downside scenarios, the immediate support level appears near $1,741. Should that floor fail to hold, traders will focus on subsequent support markers at $1,524, $1,405, and eventually $1,156.
Additional analysis emphasizes the importance of the $1,700 to $1,750 price band. Market observers warn that a decisive breach below $1,700 could trigger increased selling pressure, potentially driving ETH toward levels below $1,500.
Analyst Ted Pillows shared his perspective on Ethereum, noting that ETH has slipped beneath $1,800 and emphasizing that the $1,700 to $1,750 support zone must remain intact for bulls to stage another recovery attempt. A failure at this level could open the door to sub-$1,500 price action.
Market participants are also monitoring Federal Reserve policy signals and prevailing low trading volumes as potential influences on ETH price movement heading into the end of June. The current technical picture remains straightforward: Ethereum trades within a compressed range, facing resistance between $1,794 and $1,806 while support centers on $1,741 and the broader $1,700 to $1,750 area.
Get 3 Free Stock Ebooks
Discover top-performing stocks in AI, Crypto, and Technology with expert analysis.
- Top 10 AI Stocks - Leading AI companies
- Top 10 Crypto Stocks - Blockchain leaders
- Top 10 Tech Stocks - Tech giants


