
 Struggles Below $1,700: Key Resistance Holding Back Bulls")
Key Takeaways
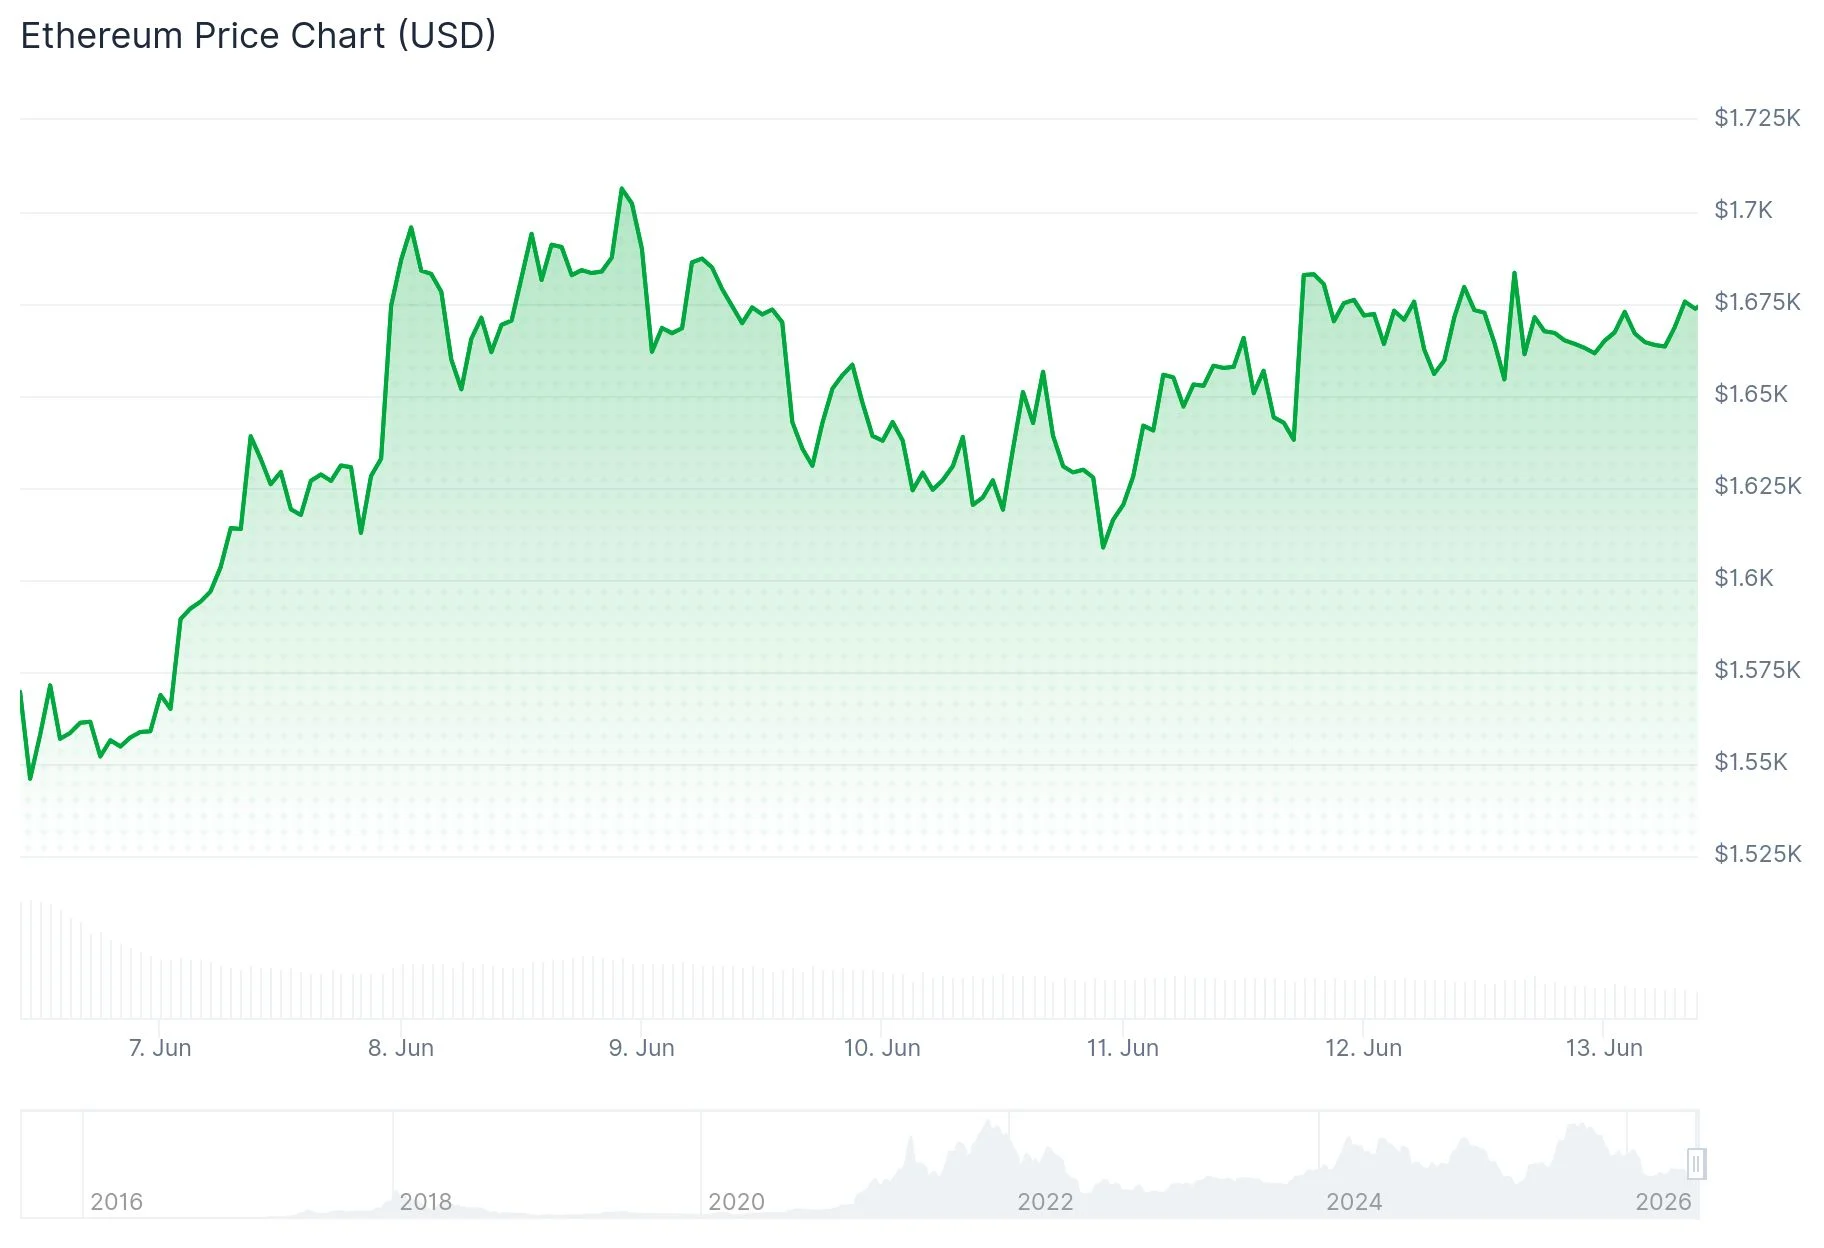
- Ethereum currently trades near $1,670 with a modest 24-hour gain exceeding 1%, though bearish technical setup persists
- Technical analysis reveals a bear flag formation maintaining downward pressure unless $1,700 resistance breaks
- Successfully breaching $1,700 could trigger a rally toward $1,850–$1,900; rejection may drive prices back to $1,500
- Approximately 500,000 ETH tokens valued around $800 million exited trading platforms last week, potentially signaling accumulation behavior
- Spot Ethereum ETFs recorded $16 million in net outflows on Thursday, marking the third consecutive day of withdrawals
Ethereum continues displaying tentative stabilization following a pronounced selloff, though the prevailing price action maintains a bearish configuration. At press time, ETH changed hands near $1,670, reflecting a 24-hour increase marginally above 1%.
This modest uptick follows a significant decline from mid-May levels, primarily fueled by escalating geopolitical tensions and broader macroeconomic headwinds. The current bounce appears tenuous rather than robust at this juncture.
Cryptocurrency technical analyst Ted highlighted that ETH remains confined within a bear flag chart pattern. This formation conventionally forecasts additional downside momentum unless price action escapes the pattern’s boundaries.
For Ethereum to reverse its current trajectory, a decisive daily close above the $1,700 resistance threshold becomes essential. Successfully clearing this barrier could unlock bullish momentum toward the $1,850–$1,900 zone.
Should this resistance level prove insurmountable, the probability of renewed downward movement increases substantially. Under such circumstances, the $1,500 support area would emerge as the next critical downside target.

Significant Exchange Outflows Suggest Potential Holder Accumulation
Market analyst Ali Charts highlighted on X that approximately 500,000 ETH tokens — representing roughly $800 million in value — were removed from centralized exchanges during the previous seven days. Substantial withdrawal activity from trading venues can suggest that market participants are transferring assets to self-custody solutions, which market observers frequently interpret as an early-stage accumulation indicator.
Blockchain metrics provide additional perspective on current market dynamics. The count of active Ethereum addresses declined to approximately 480,000 on Thursday, retreating from 554,000 previously and substantially below the 738,000 recorded in late April.
Decreasing active address counts during a price recovery attempt indicates limited broad-based participation in the rebound. Such divergences between price action and network activity frequently precede corrective movements.
Spot ETF Withdrawals Compound Selling Pressure
Ethereum spot exchange-traded funds have experienced three consecutive sessions of capital outflows. Thursday’s withdrawal total reached $16 million, following $41 million on Tuesday and $36 million on Wednesday.
Derivatives market indicators similarly reflect prevailing caution among traders. Open interest in Ethereum futures contracts fell to $22.98 billion on Friday, declining from $30.95 billion recorded at June’s beginning.
The MACD indicator registers at approximately -138.24, positioned beneath the signal line at -130.37, confirming bearish momentum dominance. The RSI indicator hovers marginally above 30, indicating the asset approaches oversold conditions without confirming a directional reversal.
ETH trades considerably below its 50-day, 100-day, and 200-day exponential moving averages positioned at $2,000, $2,148, and $2,405 respectively. These technical levels constitute formidable overhead resistance barriers.
Current market data shows ETH at $1,688, remaining constrained beneath the $1,700 threshold with no validated buy signal emerging on daily timeframe charts.
Get 3 Free Stock Ebooks
Discover top-performing stocks in AI, Crypto, and Technology with expert analysis.
- Top 10 AI Stocks - Leading AI companies
- Top 10 Crypto Stocks - Blockchain leaders
- Top 10 Tech Stocks - Tech giants


