
 Extends Historic Losing Streak as Price Falls Under $80")
Key Highlights
- For the first time ever, Solana has experienced eight consecutive months of declines, with 2026 losses reaching 36.4%.
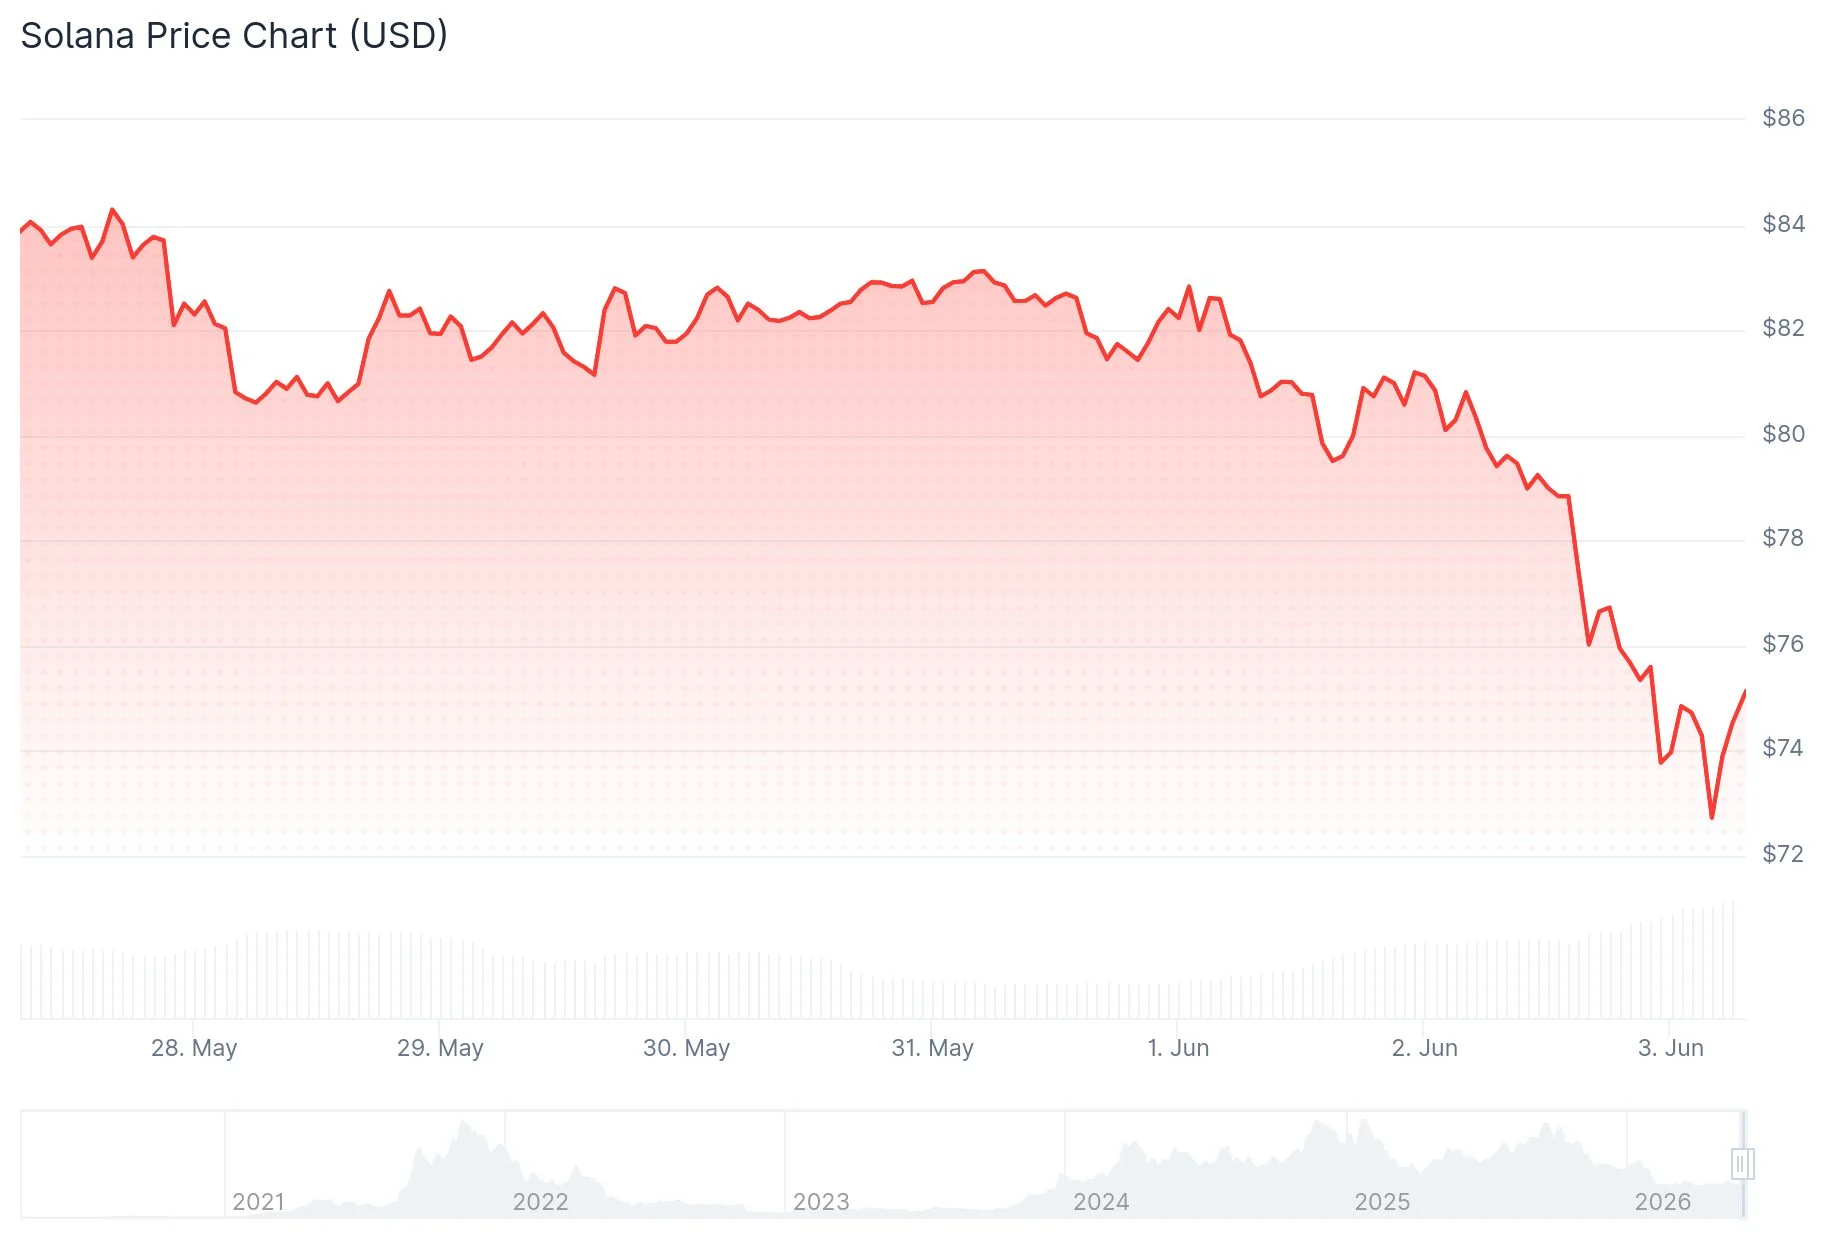
- The token breached critical $80 support, dropping to an intraday low of $75.58, with analysts watching $70 closely.
- Decentralized exchange activity on Solana plummeted 82% during late May, declining from $104.3B to just $18.8B weekly.
- Bitcoin ETFs experienced $1.42 billion in net withdrawals during the week through May 29, extending redemptions to eleven consecutive sessions.
- Technical analyst CryptoBullet forecasts a potential decline toward $50 by July if current downtrend persists.
Solana (SOL) experienced approximately 5% losses on Tuesday amid widespread cryptocurrency market weakness. The aggregate digital asset market capitalization contracted 3.44% within a 24-hour window. Exhibiting heightened volatility characteristic of high-beta cryptocurrencies, SOL initially descended to roughly $77 before ultimately reaching an intraday bottom at $75.58.
This downturn extends Solana’s unprecedented eighth straight monthly decline—an unwelcome record throughout the network’s entire existence. Year-to-date figures for 2026 show SOL down 36.4%. Comparatively, Ethereum has declined 33.5% during the identical timeframe, a noteworthy observation considering Solana’s previous positioning as a superior performance alternative to ETH.
U.S.-listed Bitcoin spot exchange-traded funds recorded $1.42 billion in combined outflows for the week concluding May 29, representing the eleventh consecutive trading session of withdrawals. Market analysts interpret this trend as institutional investors retreating from higher-risk digital assets. Historical patterns demonstrate that when Bitcoin ETF appetite diminishes, alternative cryptocurrencies such as SOL typically experience amplified downward pressure.
Blockchain Activity and Trading Volume Deteriorate
Blockchain metrics reinforce the bearish narrative. Weekly decentralized exchange volume on Solana collapsed by 82% throughout May’s latter half, contracting from $104.3 billion to $18.8 billion as speculative meme token trading enthusiasm waned. Daily active wallet addresses remain stable around 2.1 million, maintaining SOL’s third-place ranking among Layer 1 blockchain networks for this indicator. However, revenue metrics present a less favorable outlook: across the trailing twelve months, Solana accumulated $317.6 million in total fees while retaining only $39.1 million in actual revenue—a performance ratio that pales in comparison to Tron’s $3.1 billion.
SOL currently maintains its position as the seventh-largest cryptocurrency by market valuation at $44.58 billion.

Chart Analysis Suggests Further Downside
The $80 price floor, which provided support through multiple retests over recent months, has now been definitively breached. Technical analysis principles suggest that broken support zones frequently transform into resistance barriers. All moving average indicators monitored by TradingView, spanning from 10-day through 200-day timeframes, currently flash Sell signals. The Relative Strength Index registers 29.38—technically entering oversold territory—though persistent downtrends often invalidate bounce expectations despite oversold readings.
Derivatives market open interest has contracted to $5.48 billion while funding rates hover near neutral at -0.0025%, indicating minimal short positioning that could potentially fuel a short squeeze recovery.
Technical strategist CryptoBullet, who characterized the current formation as a “big breakdown,” projects Solana could gravitate toward the $50 zone by July. More immediately, $70 represents the probable next destination should the $75–$78 range prove unable to contain selling pressure. Establishing a legitimate trend reversal would require SOL to recapture $80 before challenging $85 resistance.
SOL has declined 9.23% across the current week, 46.63% over the trailing six-month period, and 38.05% year-to-date. The five-year return stands at a positive 149.62%.
Get 3 Free Stock Ebooks
Discover top-performing stocks in AI, Crypto, and Technology with expert analysis.
- Top 10 AI Stocks - Leading AI companies
- Top 10 Crypto Stocks - Blockchain leaders
- Top 10 Tech Stocks - Tech giants


