
 Price Could Slide to $1,800 Before Recovery Begins, Historical Data Shows")
Key Highlights
- Ethereum has declined 12.5% over the last 30 days, underperforming all top 5 cryptocurrencies
- Historical data shows ETH has finished June negatively in 7 out of 10 previous years
- Price action shows weakness near $2,000, with technical indicators pointing to $1,800 support
- Futures open interest reached an unprecedented peak of 15.98 million ETH on May 27
- Technical analyst Ali Charts identifies $1,825 as potential buy zone with targets at $2,073 and $2,360
Ethereum is experiencing significant selling pressure this month. Over the last 30 days, ETH has declined 12.5%, marking the weakest performance among all top five digital assets by market capitalization.
As competing assets such as BNB and Hyperliquid capture market interest following new exchange-traded fund approvals in the United States, Ethereum has failed to maintain upward momentum.
Currently, ETH trades just beneath $2,010, positioned below its 100-hour Simple Moving Average. A previously established bullish trend line at $2,015 has been violated on the hourly timeframe.
The asset touched $1,965 intraday before staging a modest bounce. Nevertheless, selling pressure resumed below $2,020, leaving bearish forces in command.
The daily Relative Strength Index has fallen to 32, approaching oversold conditions without quite reaching that threshold. A decisive breakdown below the $2,000 psychological level could trigger additional downside movement.

Historical June Performance Suggests Weakness
Seasonal trends present a challenging outlook for ETH during this period. Data compiled by CoinGlass reveals that Ethereum has recorded negative returns in June during 7 of the past 10 years. These declines have ranged from modest 1.5% pullbacks to severe 45% corrections.
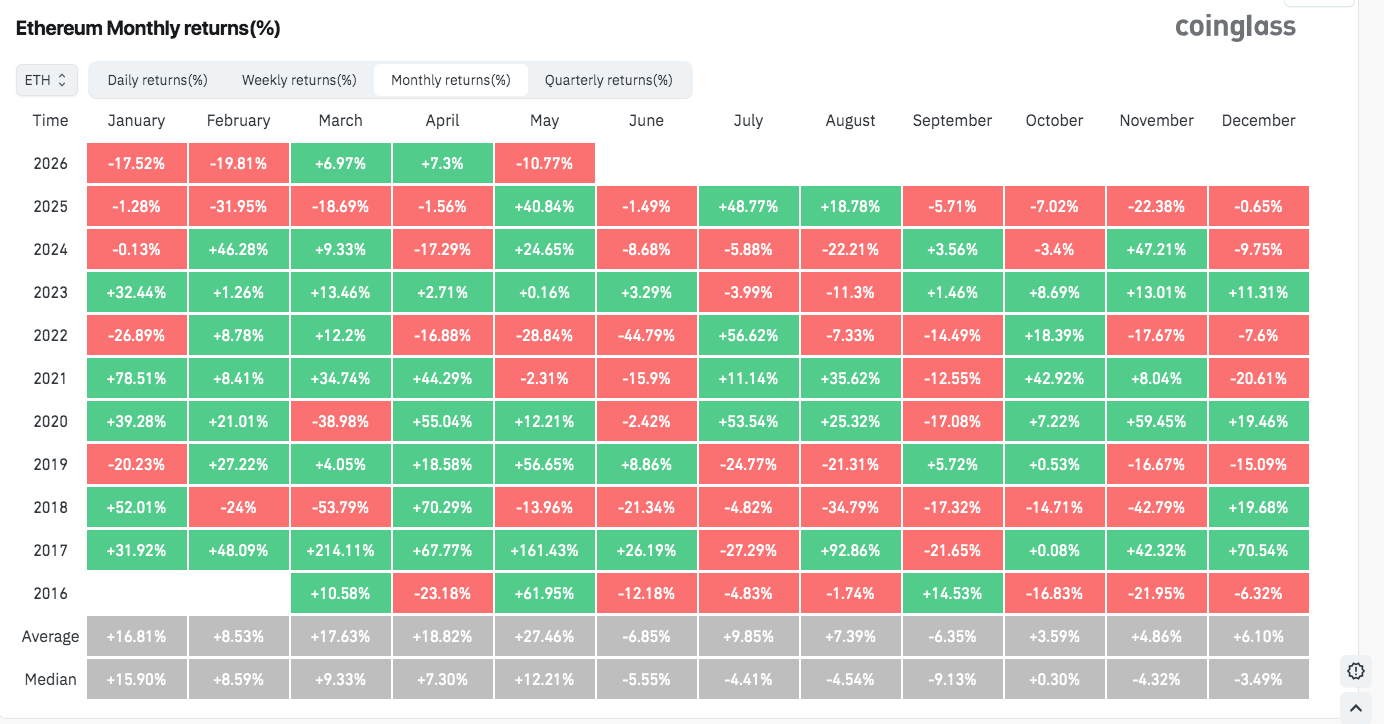
Given this historical precedent, a decline toward the $1,800 level appears increasingly probable should the $2,000 support zone fail to hold.
Critical downside levels include $1,965 as the immediate support, followed by $1,920, and then $1,850. The primary support zone is established around $1,780.
Market analyst Ali Charts highlighted on X that Ethereum is nearing the lower boundary of its trading channel around $1,825. According to his analysis, this level represents an attractive risk-reward entry opportunity, with potential upside targets at $2,073 and $2,360, contingent upon maintaining support above $1,750 on daily closing prices.
Futures Positioning Reaches Unprecedented Levels
Despite the bearish price action, open interest in ETH futures surged to an all-time record of 15.98 million ETH on May 27, as reported by CoinGlass.
When denominated in ETH rather than dollar terms, this metric eliminates price fluctuation distortions. The data indicates that market participants are establishing significant positions in anticipation of a substantial price movement.
Additionally, the weekly RSI has dropped below the 30 threshold. Historical analysis shows that the previous three instances of this occurrence were followed by substantial gains over the subsequent 6 to 12-month periods.
For bullish momentum to reassert itself in the near term, Ethereum must reclaim territory above $2,050. A successful break beyond this resistance could propel prices toward $2,085, followed by $2,120, and possibly $2,150.
Presently, ETH remains below $2,010 with immediate attention focused on whether the $1,965 support level will hold or break.
Get 3 Free Stock Ebooks
Discover top-performing stocks in AI, Crypto, and Technology with expert analysis.
- Top 10 AI Stocks - Leading AI companies
- Top 10 Crypto Stocks - Blockchain leaders
- Top 10 Tech Stocks - Tech giants


