



Key Highlights
- DOGE is currently trading between $0.1014 and $0.1026, maintaining critical support above the $0.10 threshold.
- Technical charts reveal a falling wedge formation, traditionally a bullish reversal signal that has traders anticipating a potential upward move.
- Institutional confidence remains evident with $860,960 in net inflows into DOGE spot ETFs recorded during the previous week.
- Critical resistance is positioned at $0.1050; successfully breaking through could propel prices toward $0.1100 and subsequently $0.1150.
- Chart analysts suggest a potential bottom may be establishing on weekly timeframes, though $0.0883 represents significant downside exposure should current support levels collapse.
Dogecoin maintained its position above the psychologically important $0.10 threshold throughout Tuesday’s trading session, even as broader cryptocurrency markets experienced downward pressure. The meme coin exchanged hands at $0.10259, reflecting a modest 0.74% decline over the preceding 24-hour window, while trading volume surged by an impressive 31% to reach $719.25 million, signaling robust ongoing market participation.
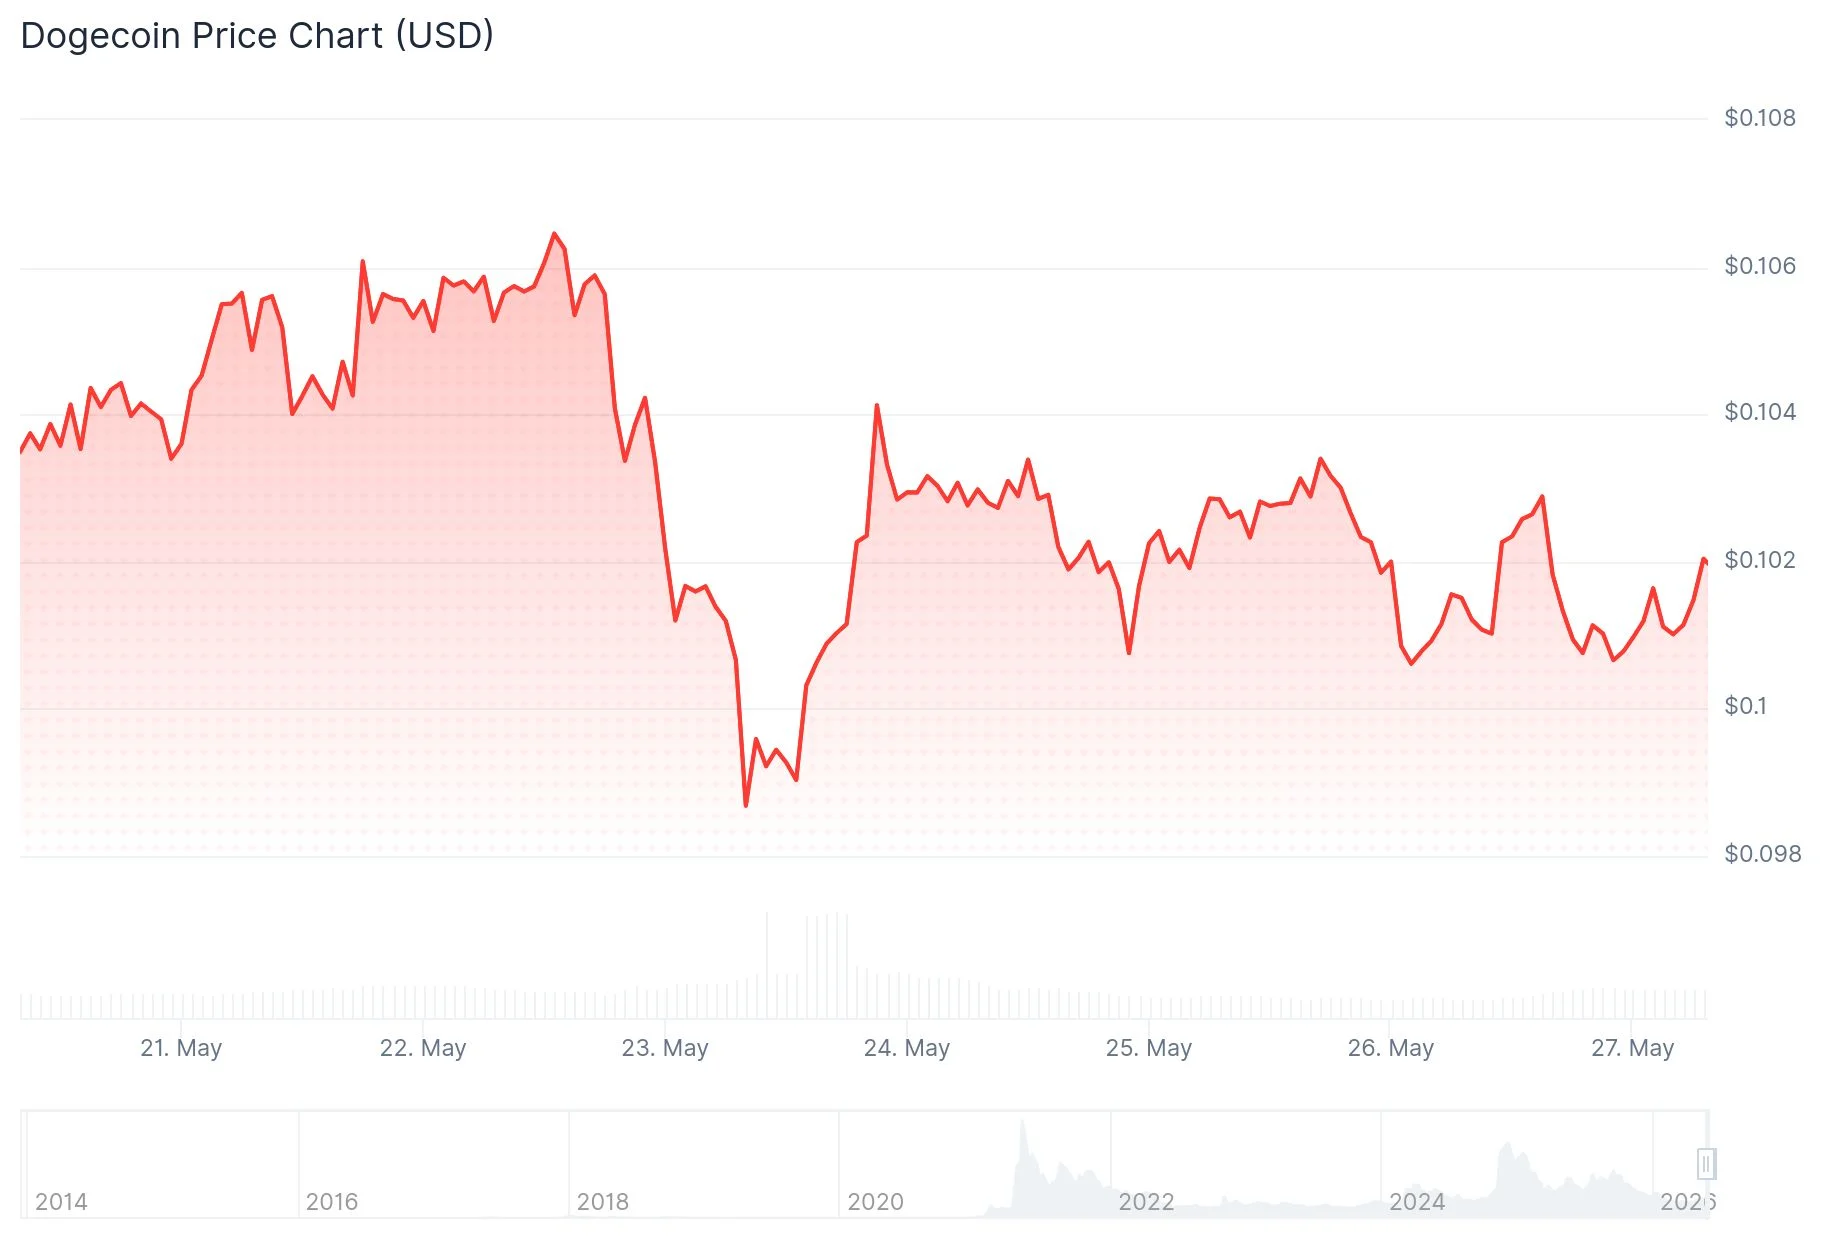
The cryptocurrency sector as a whole experienced a 1.33% contraction during the same timeframe, reducing aggregate market capitalization to $2.56 trillion. Bitcoin’s 1.01% decline to $76,866 created additional headwinds for alternative cryptocurrencies, with DOGE among those feeling the impact.
Market participants attributed the downturn to recently executed U.S. defensive military operations targeting Iran, prompting investors to adopt more conservative positioning. Meme-based cryptocurrencies faced disproportionately steeper declines compared to the broader digital asset ecosystem during this period of heightened uncertainty.
Nevertheless, Dogecoin continued demonstrating appeal among institutional capital allocators. According to intelligence from Sosovalue, DOGE-focused spot exchange-traded funds have maintained four consecutive weeks of net positive capital inflows. The most recent seven-day period witnessed $860,960 entering these investment vehicles, underscoring persistent appetite from sophisticated market participants.
Falling Wedge Pattern Draws Attention
Cryptocurrency market analyst Trader Tardigrade observed that DOGE has been consolidating within a falling wedge configuration spanning multiple weeks. This technical formation represents a compression phase where price boundaries gradually narrow as market forces reach equilibrium, frequently preceding significant directional movements.

Historically, this chart pattern demonstrates a statistical tendency toward upward resolution. Market participants are maintaining vigilance for a definitive breach above the wedge’s upper boundary, which would provide preliminary confirmation of shifting momentum dynamics favoring DOGE bulls.
Examining the 4-hour timeframe reveals current pricing at $0.1014 with near-term resistance positioned at $0.1050. Successfully clearing that threshold would establish a trajectory toward $0.1100, while sustained buying pressure could extend gains to $0.1150, a price zone that previously served as resistance during the first half of this month.
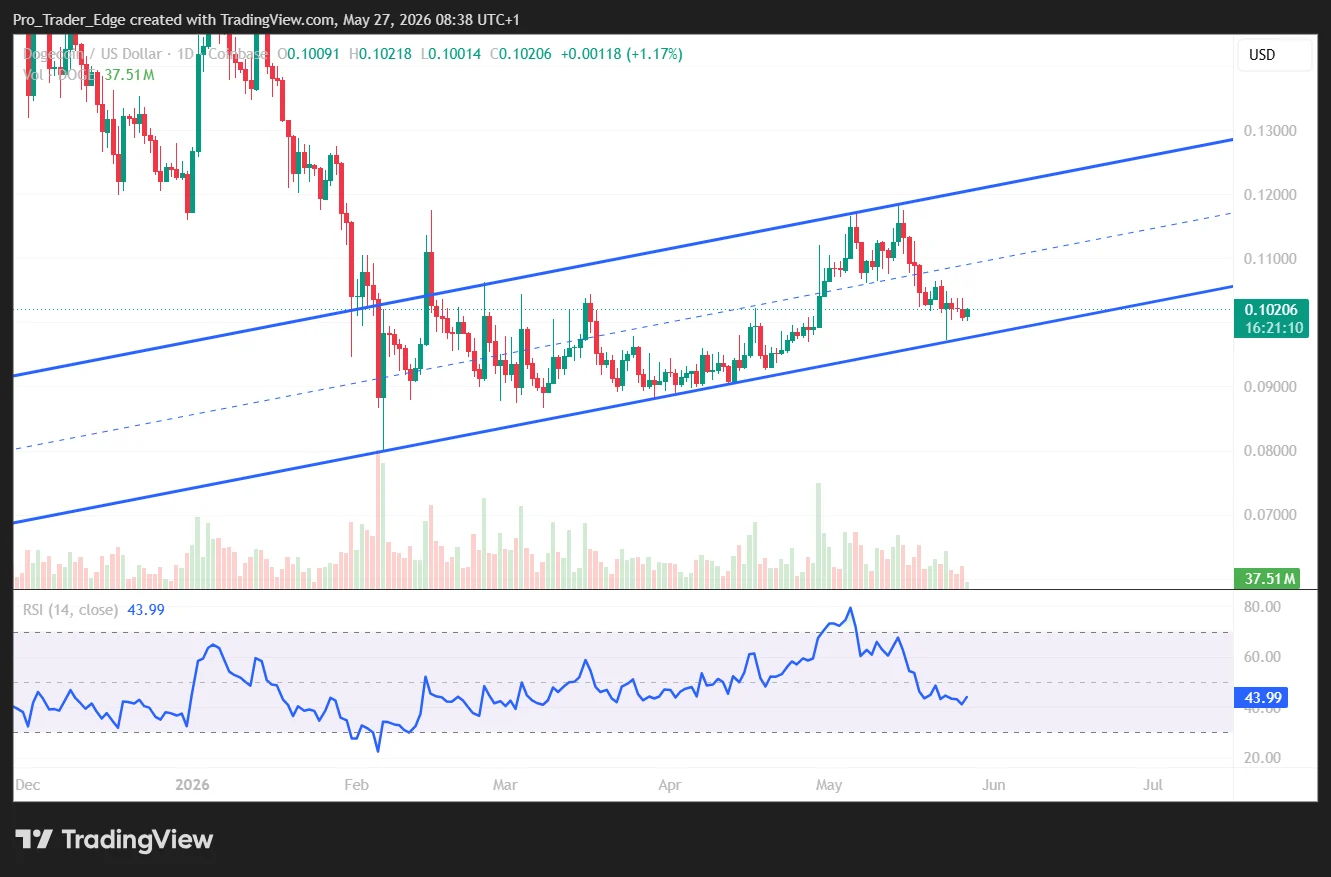
The Relative Strength Index currently registers approximately 44.50, indicating subdued momentum without reaching oversold territory. The MACD indicator maintains slight negative readings, though the histogram displays preliminary indications suggesting potential momentum recovery.
Key Support Levels to Watch
Analyzing daily chart structures, technical analyst Ali Charts identified the $0.1020–$0.1027 range as a pivotal support zone. This area derives enhanced significance from its convergence with both the channel’s midpoint and the 50-day simple moving average, providing multiple layers of technical reinforcement.
DOGE recently retreated from the upper boundary of its multi-week channel positioned near $0.1156. This price point now represents the primary upside objective should buyers successfully defend current support zones.
Should existing support structures fail, Ali Charts identified the channel’s lower boundary approaching $0.0883 as the subsequent downside destination.
On weekly chart intervals, analyst Moe identified an emerging pattern bearing resemblance to bottom formations observed during 2024. DOGE has successfully penetrated above a descending trendline, with 2026 charts revealing a rounded base structure taking form.
Moe characterized the present zone as potentially representing a local price floor. DOGE is currently testing resistance established over the preceding three months, requiring a clean breakout above this band to validate expectations for more substantial upward progression. Rejection at this juncture would maintain DOGE within its established trading boundaries.
DOGE spot ETFs most recently documented $860,960 in weekly net inflows, extending a streak of four consecutive weeks with positive flows.
Get 3 Free Stock Ebooks
Discover top-performing stocks in AI, Crypto, and Technology with expert analysis.
- Top 10 AI Stocks - Leading AI companies
- Top 10 Crypto Stocks - Blockchain leaders
- Top 10 Tech Stocks - Tech giants



