



Key Takeaways
- SOL currently hovers near $85.40, showing a 0.5% decline over the last day
- The asset remains beneath all significant EMAs, indicating bearish technical momentum
- $86.61 represents the critical near-term resistance that must be conquered
- Market observers identify $100 as the primary recovery milestone, with extended projections reaching $300–$500
- Crypto strategist Mei-Lin continues accumulating SOL with projected targets at $250, $460, and $800
Solana has remained range-bound throughout the recent trading period, showing limited volatility in either direction. The digital asset has oscillated within a confined corridor between $81.92 and $87.68 during the previous seven days, encountering consistent resistance whenever attempting to push higher.
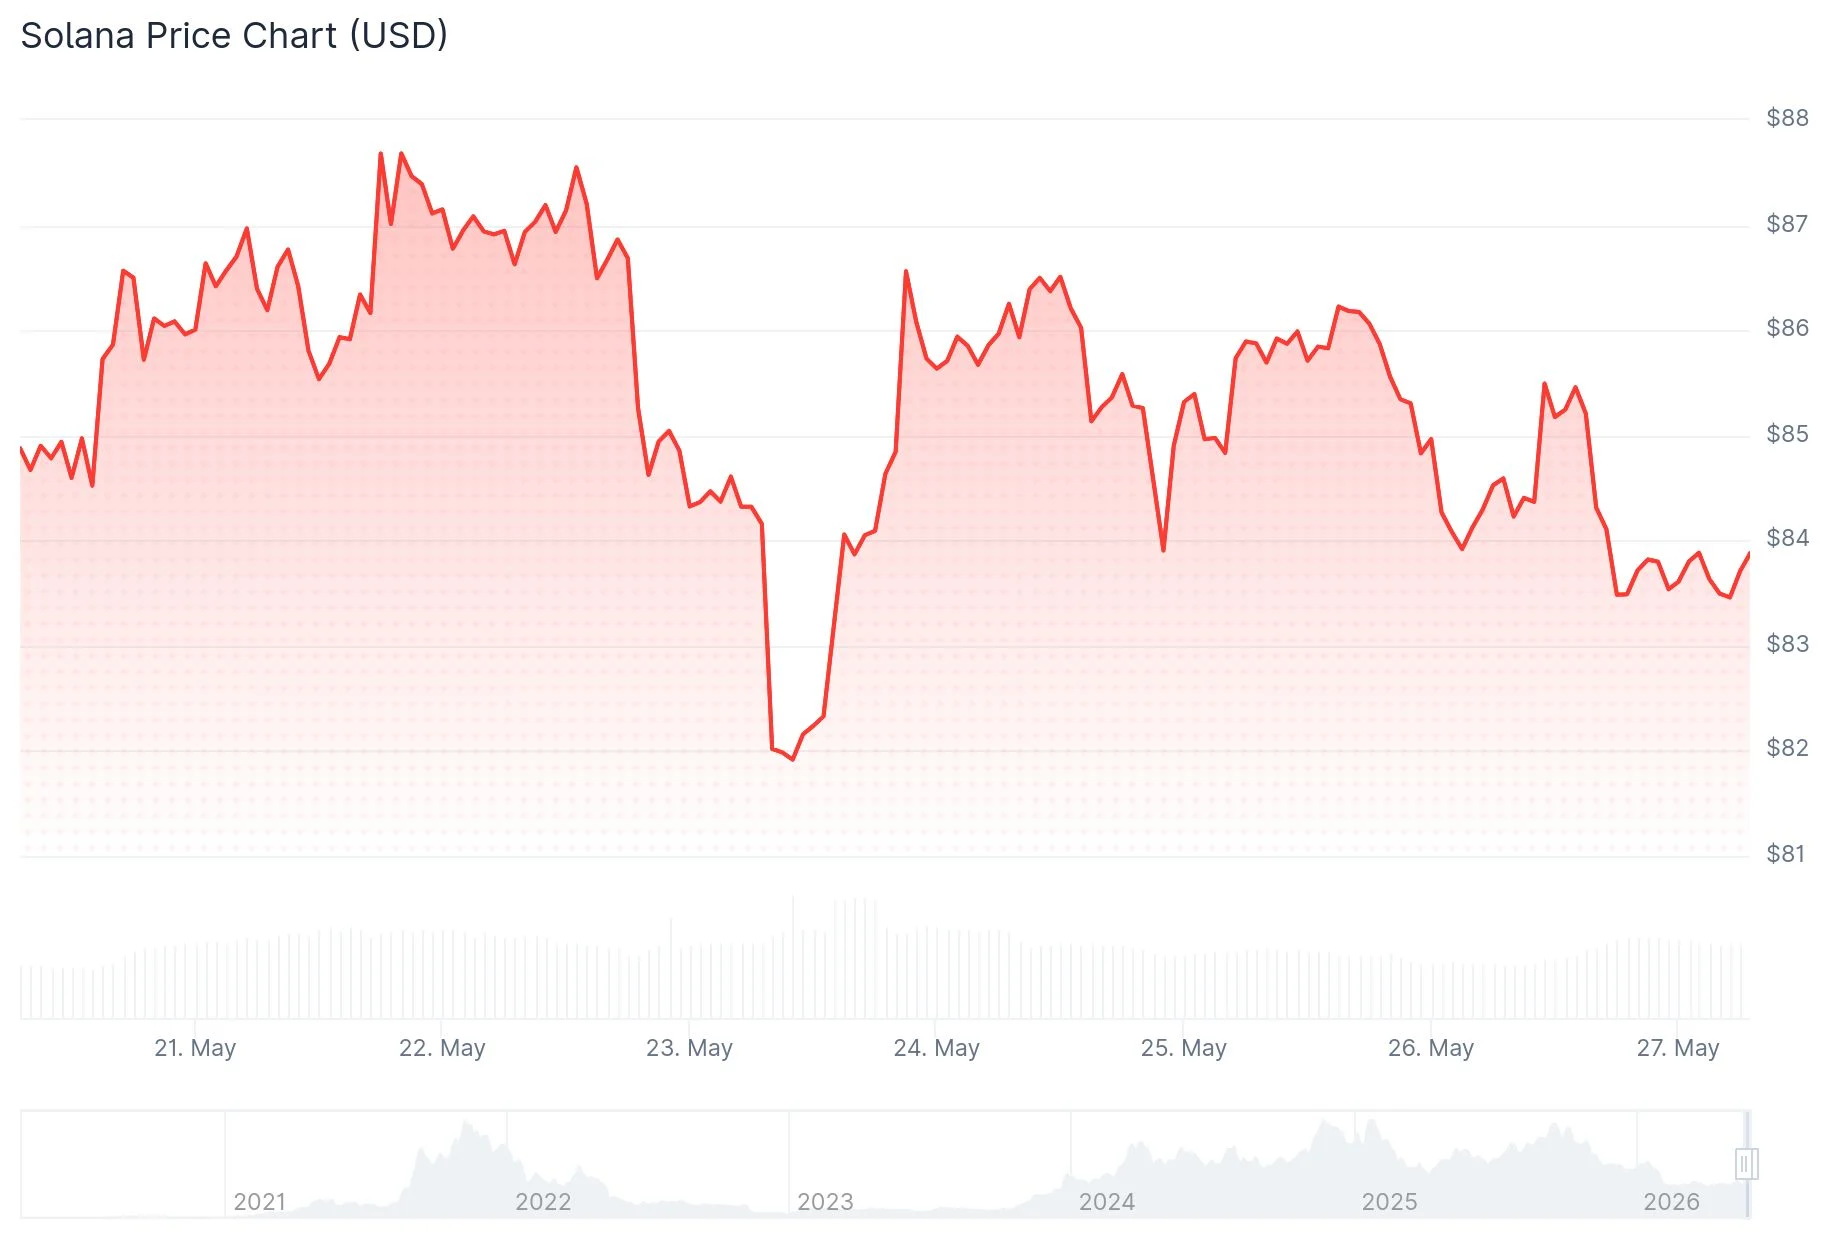
As of the latest update, SOL was changing hands at approximately $85.40, reflecting a modest 0.5% decrease across the preceding 24-hour timeframe.
The cryptocurrency momentarily climbed beyond the $86 threshold but lacked sufficient momentum to maintain elevation. This recurring behavior has persisted multiple times in recent sessions, constraining Solana within compressed boundaries without establishing definitive directional momentum.
Technical Indicators Reveal Bearish Positioning
Solana presently trades underneath its 10, 20, 50, 100, and 200-day exponential moving averages. This configuration transforms each moving average into a resistance barrier instead of providing support.
Positioning beneath the 200-day EMA generally suggests that extended-term momentum continues leaning bearish. Solana’s inability to recover this threshold maintains the overarching technical framework favoring downside potential.

The 14-day RSI registers at 45.59, positioning it within neutral range. Conversely, the weekly RSI stands at 38.64, residing in oversold conditions and demonstrating persistent selling activity across an extended timeframe.
The immediate pivot point worth monitoring is $85.26. Beyond this marker, $86.61 emerges as the crucial threshold SOL must surpass to unlock progression toward $88.43. Conversely, a breakdown beneath $85.26 would expose support zones at $83.34, followed by the $82 region.
Cryptocurrency analyst Mei-Lin has maintained close surveillance on SOL and indicates ongoing accumulation at present valuations. “We’re currently in a strong range on the daily chart; we’re likely gearing up for the next bullish wave,” she posted on X. Her near-term objectives include $250, $460, and $800.
Market Observers Focus on $100 as Critical Threshold
Multiple technical assessments highlight $100 as the pivotal level capable of transforming Solana‘s trajectory.
Analyst CryptoCurb published a technical chart illustrating Solana testing a declining trendline following base formation. A decisive breach above this trendline would redirect attention toward $100 as the subsequent upside objective. CryptoCurb drew parallels to NEAR’s recent price action, which exhibited comparable patterns before initiating upward movement.
Analyst Borovik notes that SOL has remained trapped below $100 throughout a four-month span. He anticipates movement beyond $300 once broader market conditions resume bullish momentum, with $500 remaining achievable within a twelve-month horizon. Nevertheless, this outlook fundamentally requires SOL initially recovering the $100 level.
Should purchasing pressure elevate SOL above $100, subsequent reference zones would emerge around $125, $150, and $175. Currently, Solana persists in establishing foundational support within the $80 to $90 corridor.
Get 3 Free Stock Ebooks
Discover top-performing stocks in AI, Crypto, and Technology with expert analysis.
- Top 10 AI Stocks - Leading AI companies
- Top 10 Crypto Stocks - Blockchain leaders
- Top 10 Tech Stocks - Tech giants



