



TLDR
- ETH currently positioned at $2,100, showing 1.34% daily gains while experiencing a 3.72% weekly decline
- Strong defense of $2,000 support zone observed, yet $2,150 resistance remains unbroken
- Technical indicators show RSI at 37.56 and MACD at -52.1, confirming continued selling pressure
- Successful breach of $2,150 could catalyze movement toward $2,220–$2,250 targets
- Loss of $2,065 support may trigger retest of the $2,000 psychological level
Ethereum currently hovers near $2,100 following a slight 1.34% uptick in the past day. The second-largest cryptocurrency by market capitalization continues to show weekly weakness with a 3.72% decline. CoinMarketCap data indicates the network’s market cap stands at $253.63 billion.
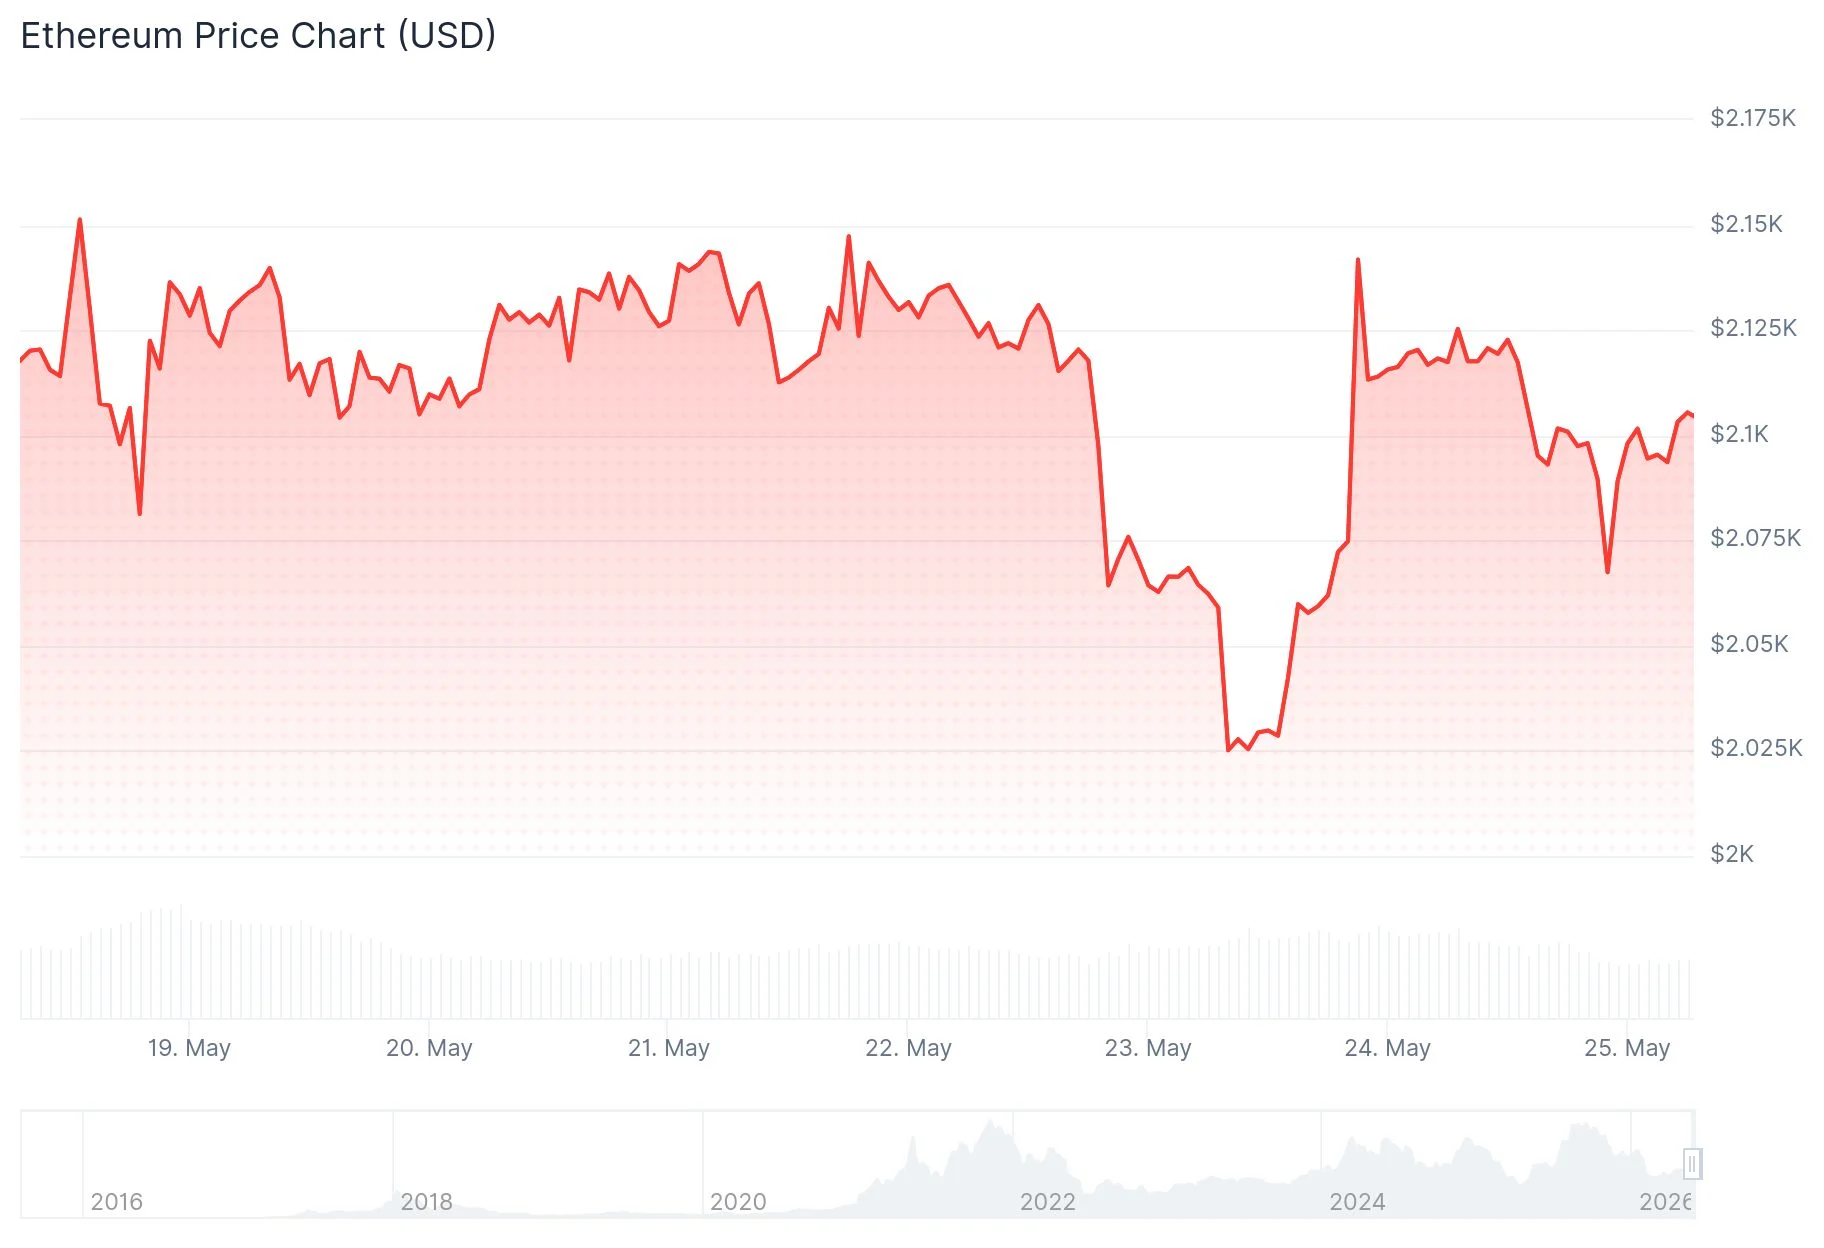
The digital asset has demonstrated resilience by rebounding from the crucial $2,000 support threshold, a development that market observers interpret as evidence of active buying pressure in that price region. Nevertheless, ETH continues to struggle with the overhead resistance established at $2,150.
Market analyst TedPillows highlighted that while the rebound from $2,000 represents a constructive development, the genuine challenge lies in whether ETH can successfully recapture the $2,150 level. According to his assessment, breaking above this barrier would likely propel prices toward $2,250. Conversely, failure to do so could result in a retreat back to $2,000.
Crypto analyst Patel shared his perspective on X, identifying the $2,000–$1,400 range as a crucial demand zone while marking $4,700 as the breakout catalyst. His long-term projection charts an ambitious trajectory toward $10K, $15K, and ultimately $20K, emphasizing: “The Smart Money Doesn’t Chase Green Candles. They Buy The Boring Range Nobody Talks About.” Patel suggests that ETH may be establishing one of the cycle’s most favorable entry opportunities.
Another market commentator, The Boss, emphasized that Ethereum’s multi-year ascending trend line, established since 2022, remains intact. ETH has recently bounced from this trend support region, which he identifies as a pivotal defense zone. He cautioned that maintaining position above this rising trend structure is essential for preserving the broader bullish framework.

Technical Indicators Reflect Continued Selling Momentum
The Relative Strength Index currently registers 37.56, positioned below the neutral 50 threshold, while the RSI moving average reads 40.10. This configuration indicates that selling forces maintain dominance, although the asset has not yet reached oversold conditions.
The MACD indicator shows the main line at -52.1, contrasted with the signal line at -35.9 and a histogram value of -16.2. These metrics reinforce the presence of active downward momentum.
Examining the hourly timeframe reveals a developing bearish trend line with resistance positioned near $2,110. ETH maintains its position above the 100-hour Simple Moving Average, providing some short-term price support.
Critical Price Zones for Market Participants
Near-term resistance barriers are established at $2,110, $2,140, and $2,150. A decisive breakout above $2,150 could pave the way toward $2,220, followed by $2,250, with extended targets reaching $2,320.
Regarding downside protection, the first support level appears at $2,075, with additional support at $2,055 — corresponding to the 61.8% Fibonacci retracement measured from the recent $2,001 bottom to the $2,147 peak. A breakdown beneath $2,055 could result in further decline toward $2,020 or the significant $2,000 level. The primary support beneath these levels is located at $1,940.
Ethereum presently trades above its 100-hour Simple Moving Average while maintaining position above $2,065, a threshold that bullish participants must preserve to sustain recovery potential.
Get 3 Free Stock Ebooks
Discover top-performing stocks in AI, Crypto, and Technology with expert analysis.
- Top 10 AI Stocks - Leading AI companies
- Top 10 Crypto Stocks - Blockchain leaders
- Top 10 Tech Stocks - Tech giants



