
 Price Analysis: Critical Support Levels Traders Must Monitor Now")
Key Takeaways
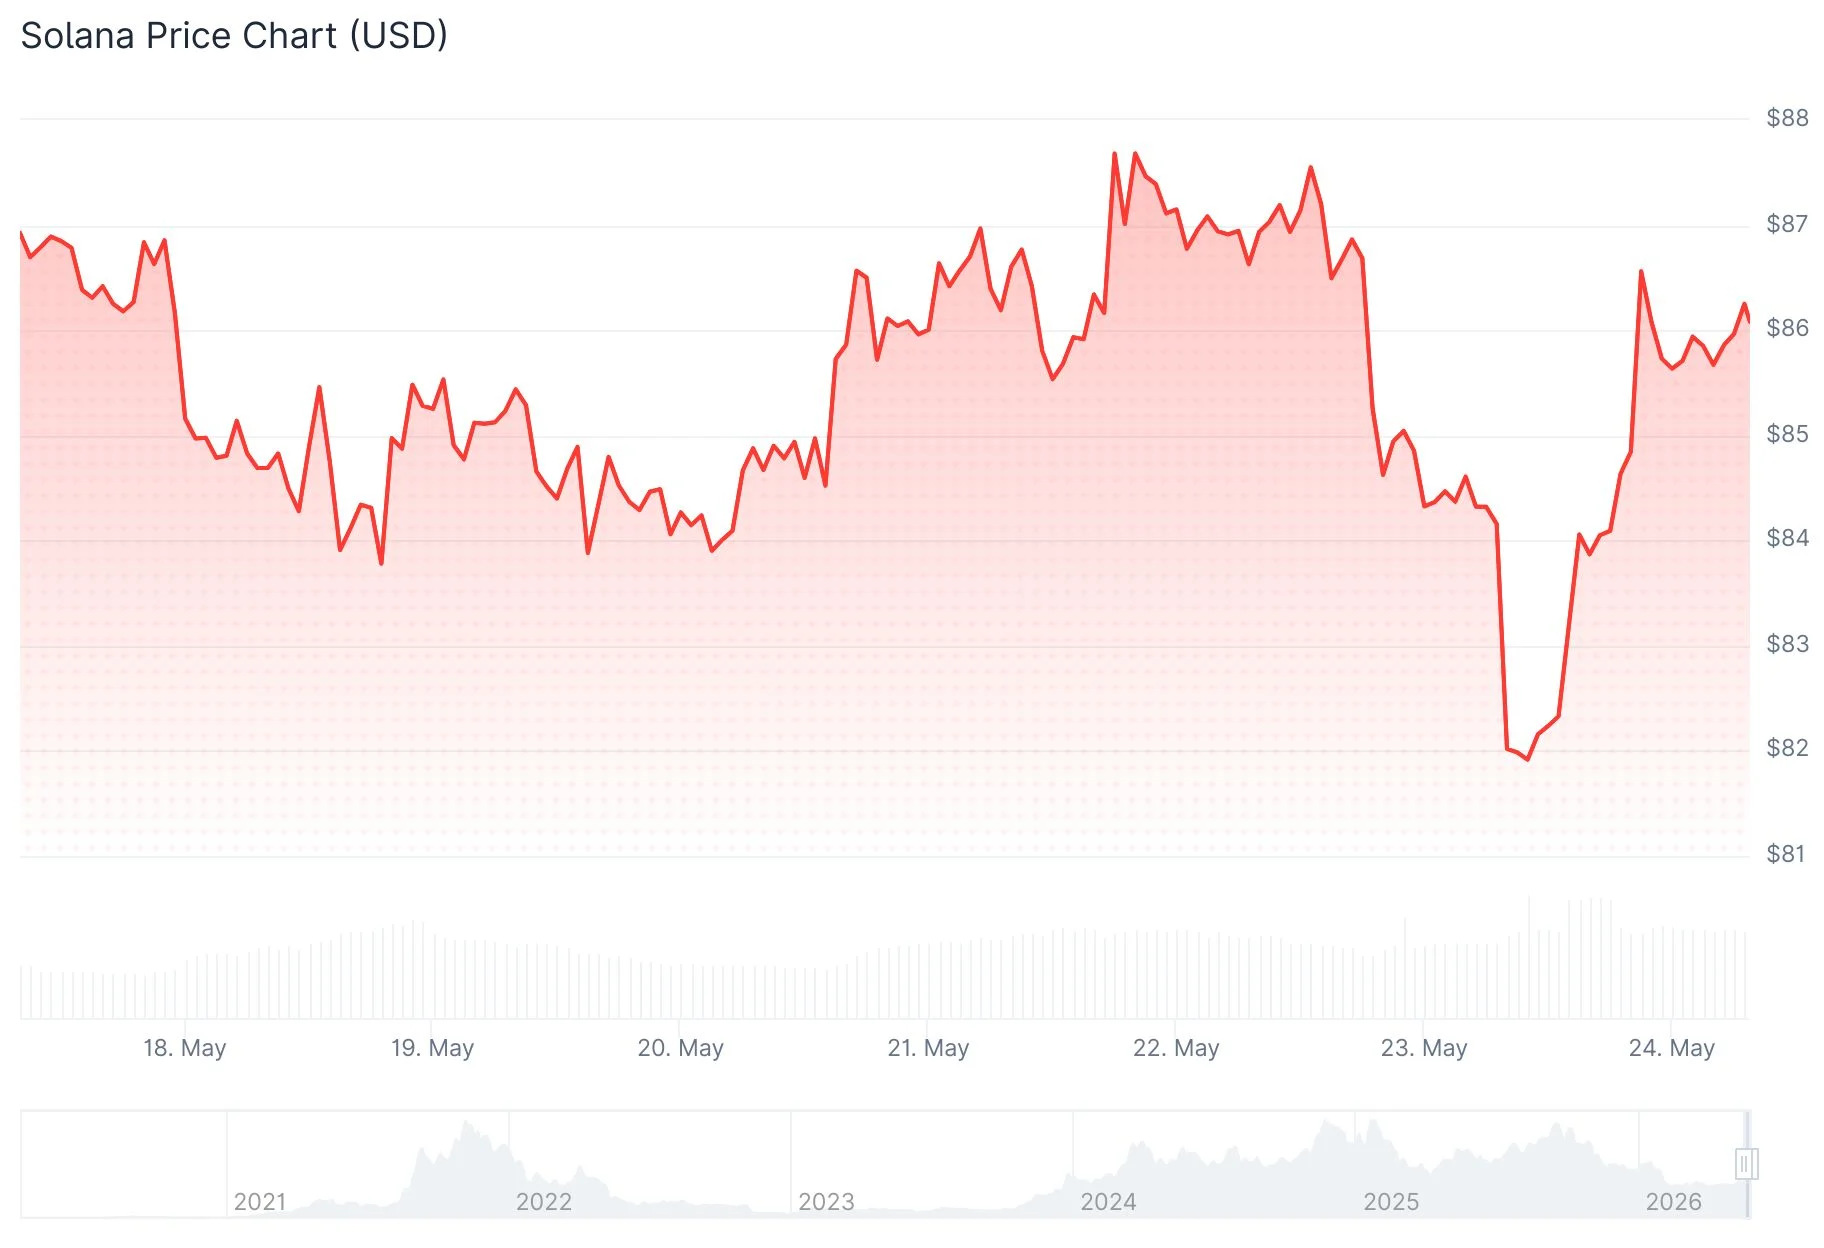
- Solana currently trades around $82, representing approximately a 70% decline from its peak near $295
- Critical near-term resistance zone located at $95 — breaking above this level on a weekly close would indicate potential relief rally
- Current support range holds between $78–$83; losing this zone could trigger a move toward $60
- The 50-week exponential moving average around $124 represents significant overhead resistance for any meaningful recovery attempt
- Trading volume jumped 10% to reach $3.89 billion despite downward price movement, suggesting aggressive distribution
Solana finds itself at a critical juncture. The cryptocurrency fluctuates around $82 based on daily timeframes and approximately $86 on weekly charts, positioned considerably beneath the dotted support area near $95 that market participants have been monitoring.
The decline from previous highs around $295 has been dramatic — roughly 70% — and market psychology mirrors this pain. Cryptocurrency analyst Whale Watch articulated the situation bluntly on social platforms: “Everyone loved SOL at $295. Nobody wants it at $86.” This observation encapsulates prevailing sentiment effectively. It highlights diminished demand during severe corrections, a characteristic frequently observed in substantial pullbacks where retail participation evaporates exactly when valuations reach their lowest points.
Purchasers have maintained the $78–$83 territory for the moment, though momentum remains fragile. A weekly closing price beneath $83 would compromise the present technical structure.
Technical Perspective
Experts at Elliott Wave Academy suggest SOL might be developing a near-term corrective bounce. Their assessment indicates a potential advance toward the 50%–61.8% Fibonacci retracement of the recent downward wave, with possibilities for extension toward the 78.6% threshold if accumulation intensifies. However, they emphasize that price behavior around these thresholds will be critical in determining subsequent direction.
Technicians from MCO Global DE characterize recent price behavior as predominantly “noise,” lacking confirmed directional breakouts. They identify immediate support at $81.28, with a more robust support cluster spanning $71.92 to $77.96. These areas have successfully absorbed distribution during recent retracements. The research group also cautions that another near-term decline remains plausible before any substantial recovery effort materializes.

For any durable upward movement, SOL must breach $95 initially. Following that milestone, focus would transition to the 50-week EMA positioned near $124, which has functioned as solid resistance since SOL surrendered this level previously in the year. A close exceeding $124 would establish potential toward $175 and $200.
Volume Activity Signals Distribution Pressure
According to CoinMarketCap information, SOL trading stands at $82.21, declining 5.83% over the preceding 24-hour period. Market capitalization rests at $47.51 billion. Daily transaction volume increased 10.04% to $3.89 billion.
The surge in volume concurrent with price depreciation warrants attention. This pattern generally signifies active distribution rather than passive consolidation. Resistance exists within the $90–$95 region on near-term charts.
The significant technical obstacle at $96 remains intact. Unless accumulation recaptures that threshold decisively, the market framework is anticipated to maintain neutral characteristics.
Technicians additionally identify $110 as an extended-term resistance area that could determine whether Solana initiates an authentic trend reversal or continues range-bound behavior.
SOL presently trades around $82.21, with downside support at $80 and upside resistance spanning $90 to $95.
Get 3 Free Stock Ebooks
Discover top-performing stocks in AI, Crypto, and Technology with expert analysis.
- Top 10 AI Stocks - Leading AI companies
- Top 10 Crypto Stocks - Blockchain leaders
- Top 10 Tech Stocks - Tech giants


