
 Shows Recovery Signs as Whales Buy 250M Tokens and TD Sequential Triggers Buy Signal")
Key Takeaways
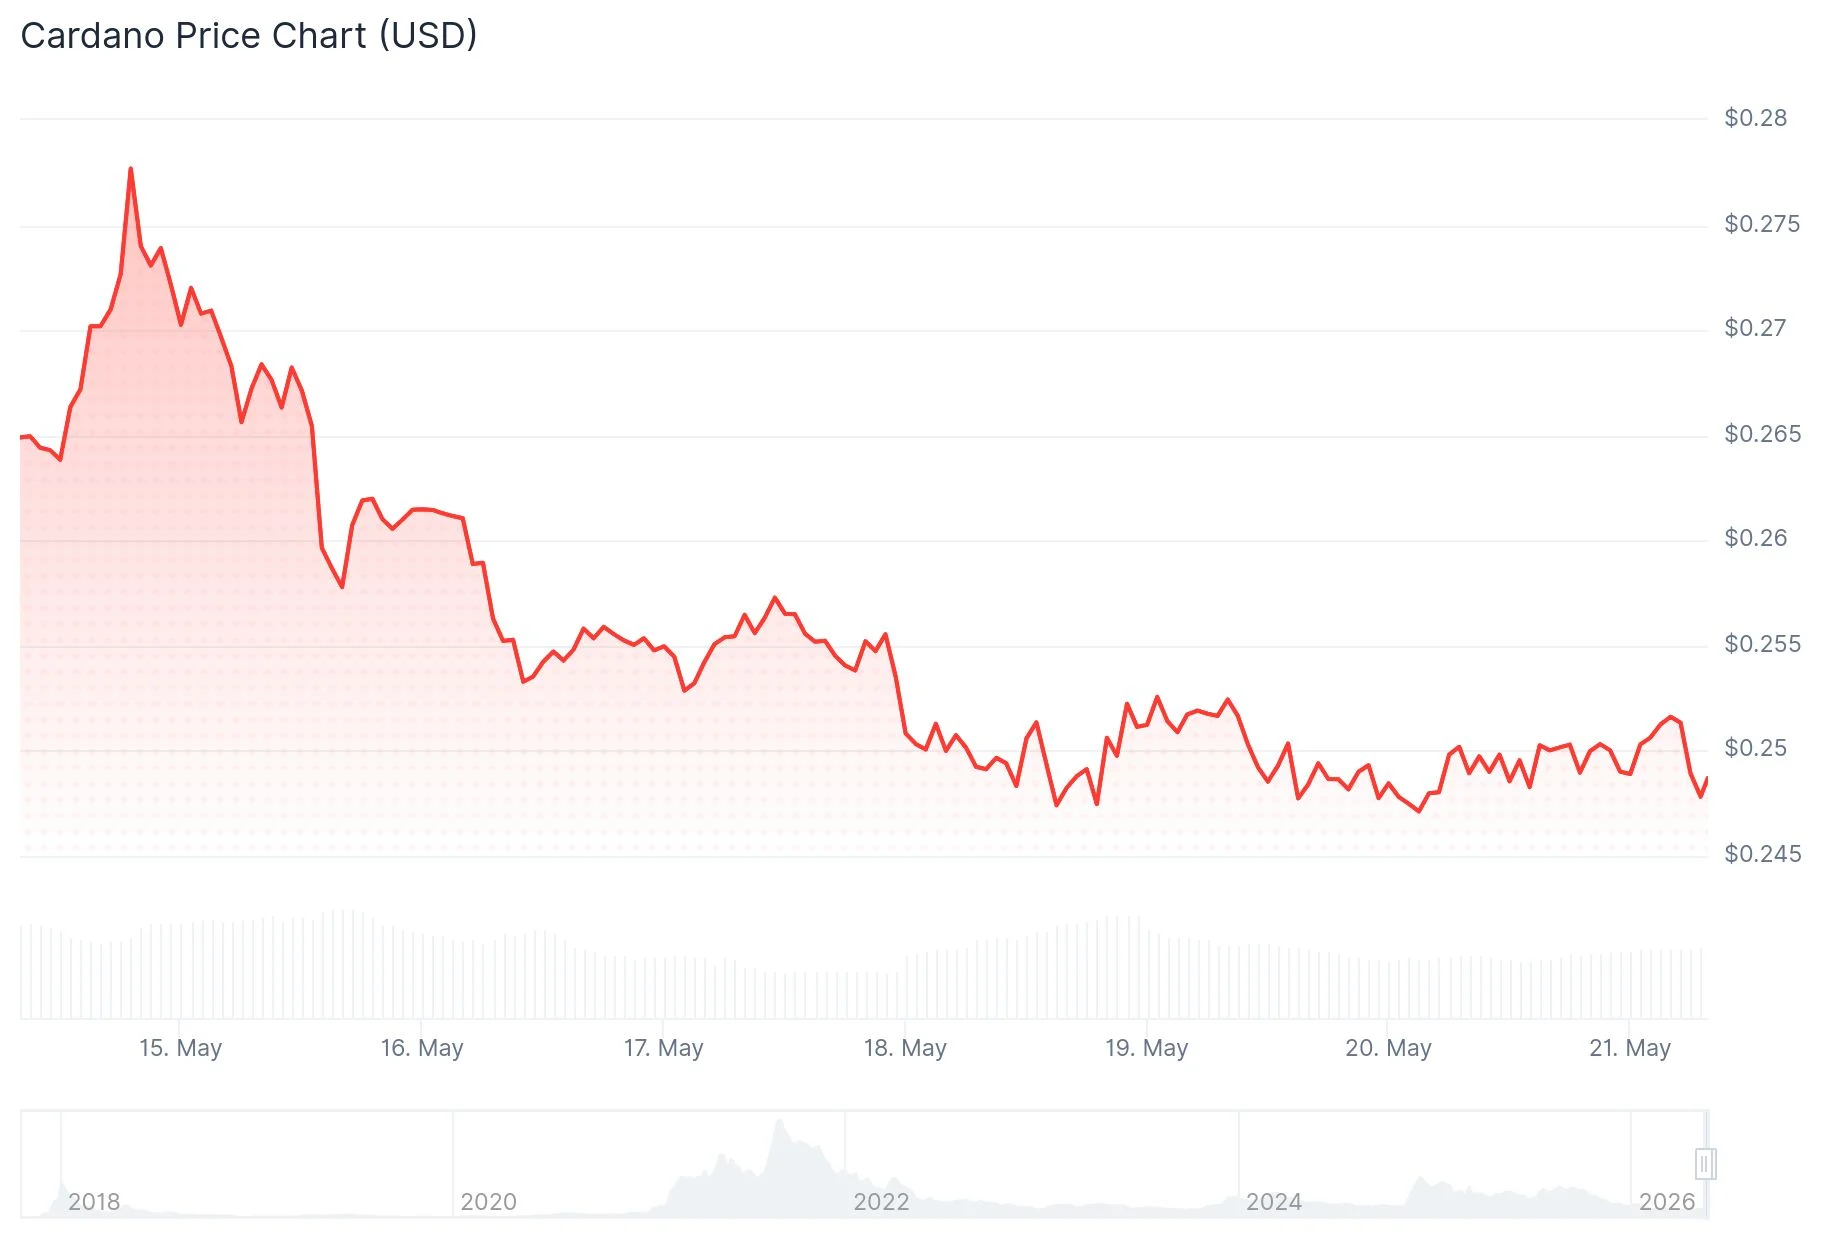
- Cardano’s price hovers near $0.25 following a five-day downtrend, showing a modest 0.68% uptick on Wednesday.
- Large holders have scooped up approximately 250 million ADA tokens starting May 11, indicating sustained institutional confidence.
- Derivatives data shows a long-to-short ratio of 0.80, indicating traders are currently favoring short positions over longs.
- Technical indicators show ADA trading beneath its 50-, 100-, and 200-day exponential moving averages, with RSI at 43 and bearish MACD readings.
- Technical analyst Ali Charts identifies a TD Sequential buy signal, targeting $0.255 initially, contingent on holding $0.246 support.
Cardano (ADA) is showing signs of stabilization following a challenging stretch of five consecutive days in the red. Currently priced around $0.2499, the cryptocurrency has gained approximately 0.68% over the last 24-hour period. While this represents a minor uptick, the overall technical landscape continues to face headwinds.
Blockchain analytics from Santiment reveal that major stakeholders have been strategically accumulating during this price weakness. Specifically, addresses containing between 100,000 and 100 million ADA tokens have increased their holdings by roughly 250 million coins since the beginning of May 11. This pattern of accumulation during market dips typically indicates strong conviction about the asset’s future prospects.
Crypto analyst Ali Charts shared via X (previously known as Twitter) that the TD Sequential indicator—which accurately predicted a 15% decline starting May 10—has now generated a buy signal. According to his analysis, a local price floor may be establishing itself, with an immediate upside objective of $0.255 and a follow-up target at $0.262. However, he emphasized that maintaining the $0.246 support level on a daily closing basis is essential for this bullish scenario to play out.
Technical Indicators Remain Challenged
Cardano continues to trade underneath its major moving average benchmarks, with the 50-day, 100-day, and 200-day EMAs positioned at $0.258, $0.280, and $0.355 respectively. The Relative Strength Index currently registers at 43, while the MACD indicator remains in bearish territory. These metrics collectively suggest weakened price momentum and indicate potential resistance to upward movements.
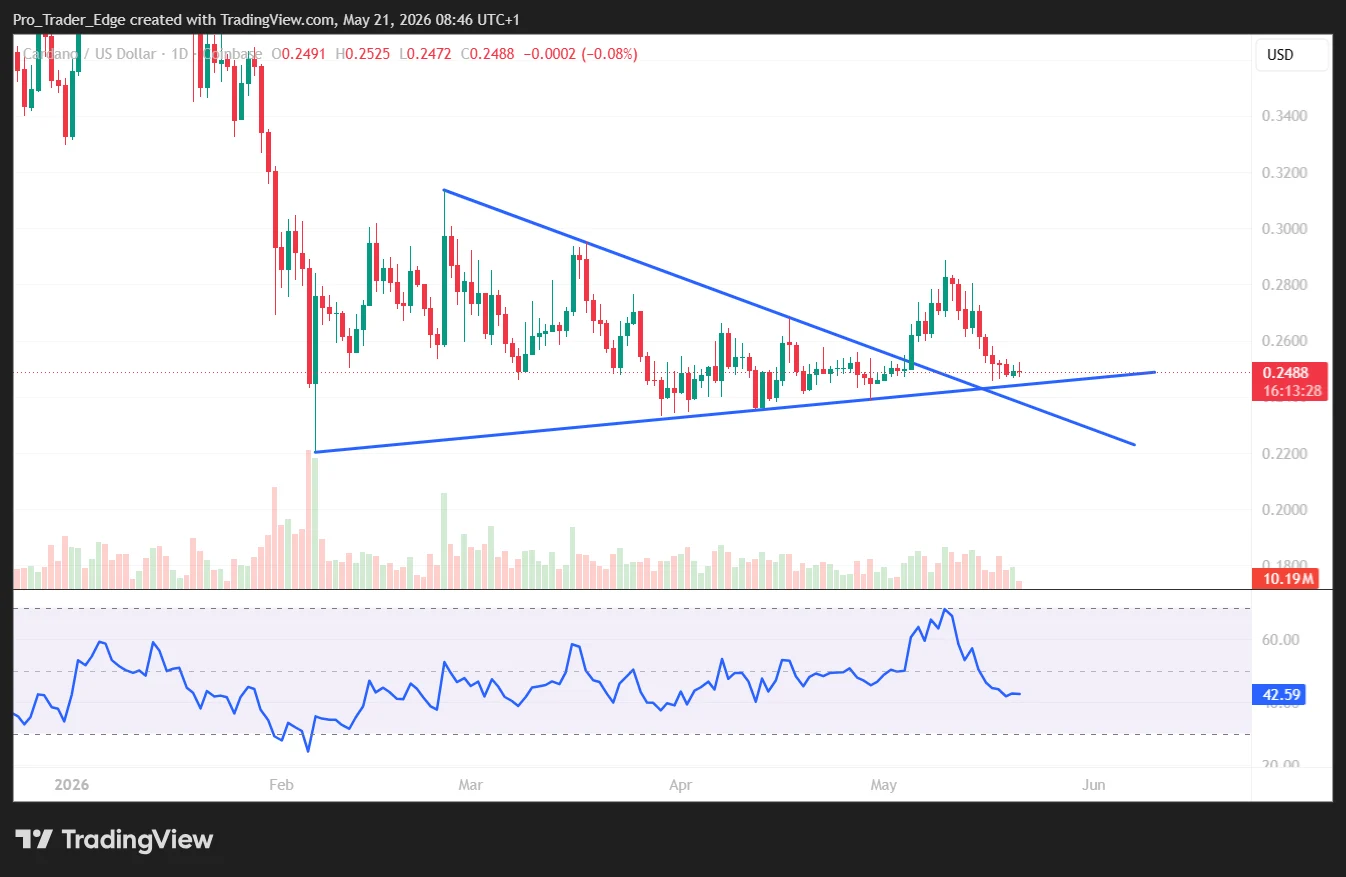
Analyzing the Bollinger Bands reveals ADA trading near the central band, maintaining position above the lower boundary situated around $0.2393. While this prevents a complete technical breakdown, it doesn’t constitute a bullish formation either.

Critical resistance zones include the 50-day EMA at $0.258, the 23.6% Fibonacci level at $0.271, and a significant trendline breakout point at $0.274. Should prices decline, support exists at $0.245, followed by $0.236, with substantial backing near the February minimum of $0.220.
Real-World Asset Strategy Adds Fundamental Dimension
The Cardano Foundation recently released a comprehensive Real-World Asset (RWA) tokenization case study via Cardano Academy. This publication demonstrates how tangible assets can be converted into digital tokens utilizing Cardano’s current technological framework. This initiative represents part of Cardano’s strategic expansion into practical, real-world blockchain applications.
Within derivatives markets, sentiment indicators present a nuanced picture. CoinGlass data shows the long-to-short ratio standing at 0.80, marking its lowest reading in more than 30 days. Concurrently, the OI-weighted funding rate shifted to positive territory on Sunday, currently registering at 0.0072%, indicating that traders holding long positions are compensating short sellers—a subtle indication of gradually improving market sentiment.
The critical $0.246 support level highlighted by Ali Charts represents the decisive threshold to monitor as the next daily candle closes.
Get 3 Free Stock Ebooks
Discover top-performing stocks in AI, Crypto, and Technology with expert analysis.
- Top 10 AI Stocks - Leading AI companies
- Top 10 Crypto Stocks - Blockchain leaders
- Top 10 Tech Stocks - Tech giants


