
 ETF Inflows Surpass $1.39B While Price Struggles at Critical Resistance")
Key Takeaways
- XRP is consolidating around $1.37 after finding support at the $1.35 level
- Spot ETF products continue attracting capital, with Tuesday’s inflows reaching $1.48 million
- Futures market activity has intensified, with Open Interest rising to $2.93 billion from $2.83 billion
- The token trades beneath its 50, 100, and 200-day exponential moving averages, signaling bearish structure
- Breaking through $1.3940 resistance could trigger a rally toward $1.42 and higher targets
Ripple’s native token is holding steady at $1.37 on Wednesday, May 21, following a rebound from a temporary floor at $1.35. This bounce follows a sharp pullback from the $1.50 mark earlier in May.
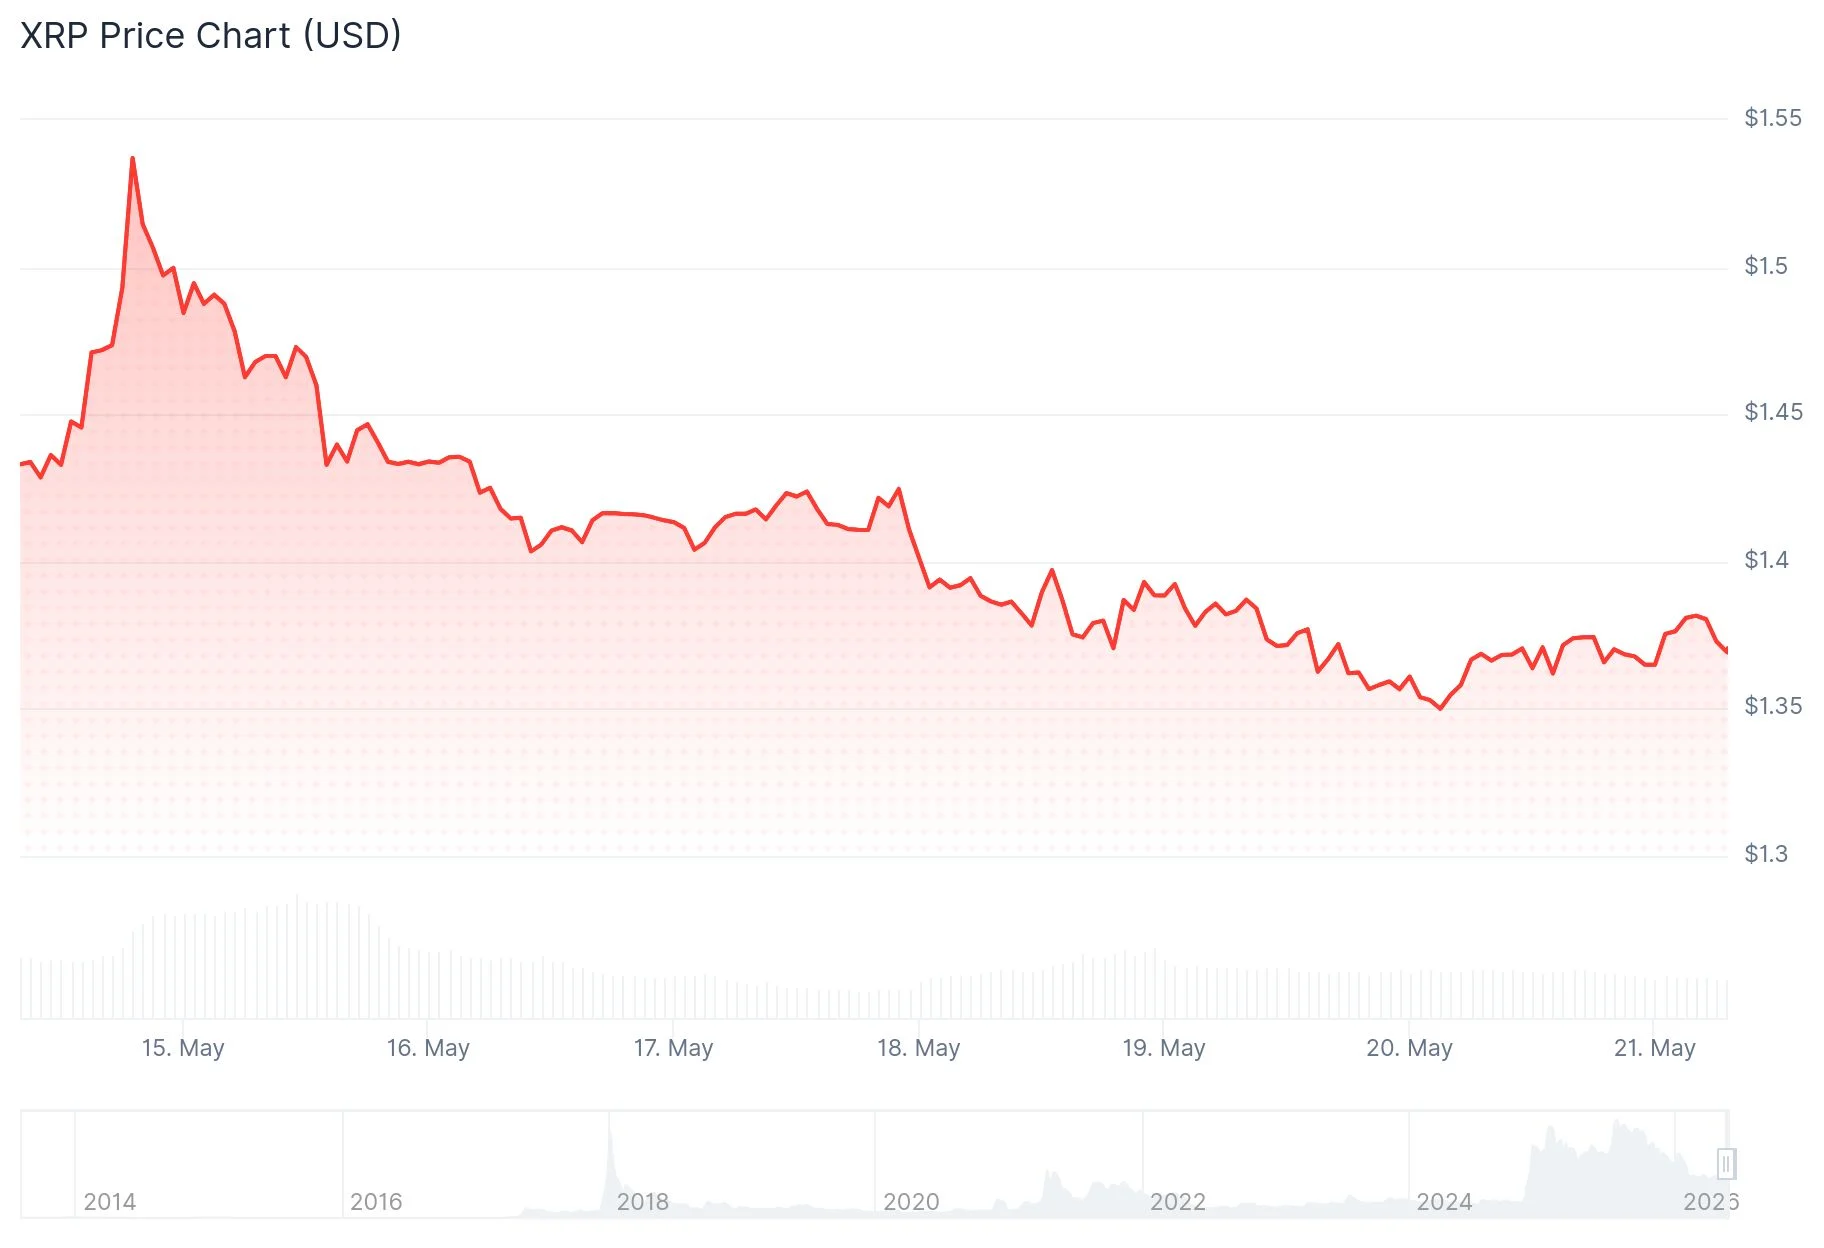
The earlier decline was influenced by broader market headwinds, including inflation figures from the United States that exceeded forecasts and escalating tensions across the Middle East region.
Market participants are anticipating the Federal Reserve’s release of its April policy meeting minutes scheduled for 18:00 GMT today. These minutes may offer crucial insights into the central bank’s monetary stance moving forward.
XRP-linked exchange-traded funds have recorded positive capital flows for four consecutive trading sessions. Tuesday’s session brought in $1.48 million, representing a significant increase from Monday’s $750,000. Total cumulative inflows have now reached $1.39 billion, while assets under management average approximately $1.12 billion, based on figures from SoSoValue.

Market analyst ChartNerd (@ChartNerdTA) noted on social media that $1.30 represents a crucial support zone should XRP lose its present technical foundation. “Each rejection at $1.50 increases the probability of a more substantial correction,” the analyst observed, pointing to emerging signs of price weakness.

Open Interest in XRP perpetual contracts has expanded to $2.93 billion as of Wednesday, marking an increase from Tuesday’s $2.83 billion. Sustained growth in Open Interest may provide momentum for a move toward the $1.40 threshold.
Critical Technical Zones
XRP is presently positioned below three significant exponential moving averages: the 50-day at $1.41, the 100-day at $1.48, and the 200-day at $1.69. This configuration maintains a bearish technical outlook for the short term.
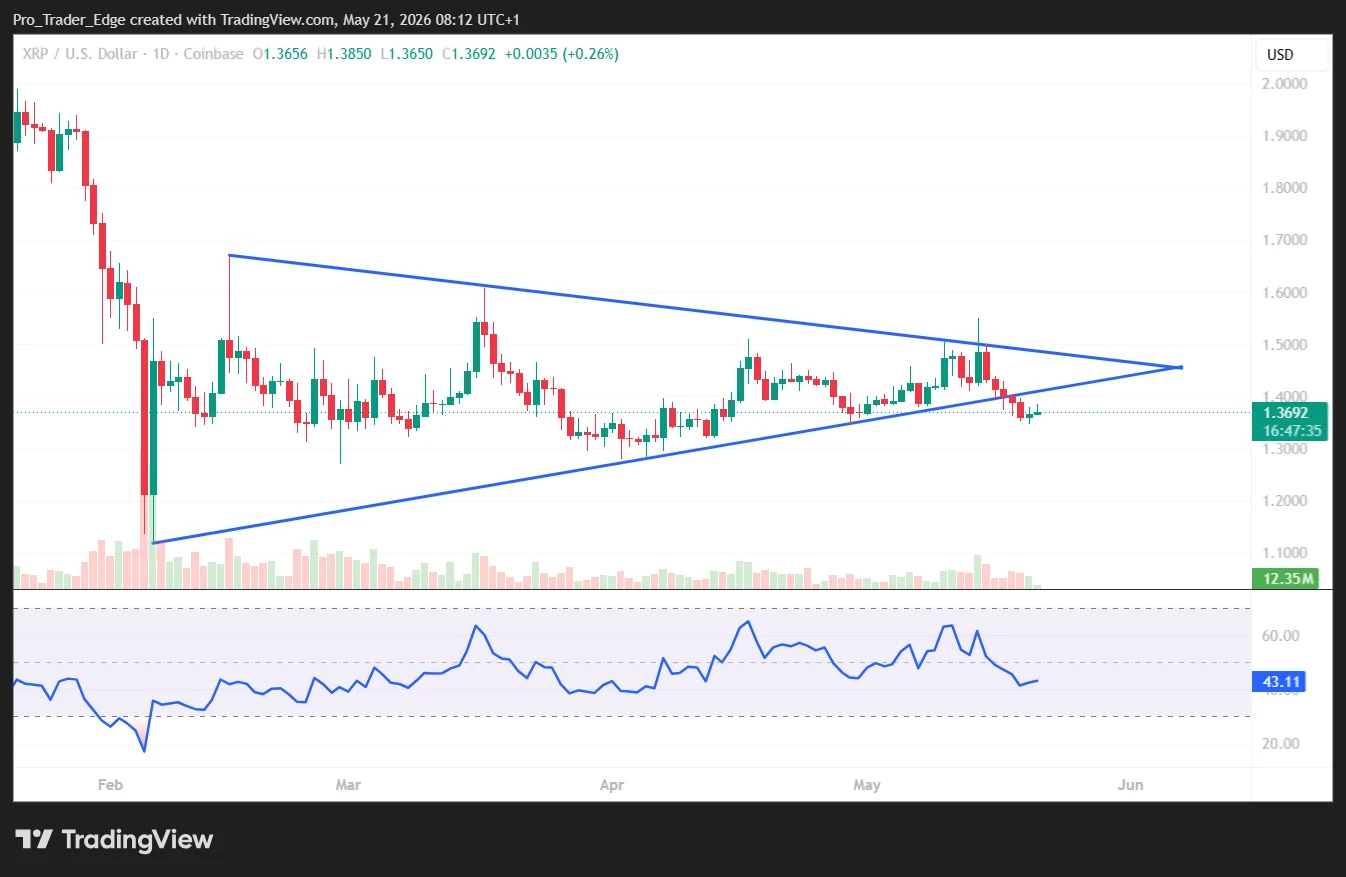
The Relative Strength Index reads in the low-40s on the daily timeframe, while the MACD histogram displays negative values with declining momentum. These indicators point to continued bearish pressure.
On the one-hour chart, XRP successfully breached a descending channel with resistance near $1.380. Nevertheless, selling pressure has materialized around the $1.3820 area.
The primary resistance barrier sits at $1.3940. A decisive close above this threshold could propel XRP toward $1.42 and beyond.
Potential Downside Scenario
Should XRP fail to overcome $1.3940, downside risks emerge. The first support zone is positioned at $1.3620, with secondary support at $1.3550.
A violation of $1.3550 would likely trigger a test of $1.3450, potentially extending to $1.3350. Further weakness could bring $1.32 into play.
Conversely, a successful break above $1.3940 would establish a path toward $1.4720, which corresponds to the 61.8% Fibonacci retracement level calculated from the decline between $1.5495 and $1.3465.
Maintaining momentum above $1.4720 would set sights on the psychologically significant $1.50 resistance, with $1.52 as the next potential target if that barrier falls.
Futures Open Interest for XRP remains elevated at $2.93 billion on Wednesday, while spot ETF products continue their positive inflow trajectory with cumulative inflows standing at $1.39 billion.
Get 3 Free Stock Ebooks
Discover top-performing stocks in AI, Crypto, and Technology with expert analysis.
- Top 10 AI Stocks - Leading AI companies
- Top 10 Crypto Stocks - Blockchain leaders
- Top 10 Tech Stocks - Tech giants


