
 Hits Critical Resistance at 200-Day Moving Average — Can Bulls Break Through?")
Key Takeaways
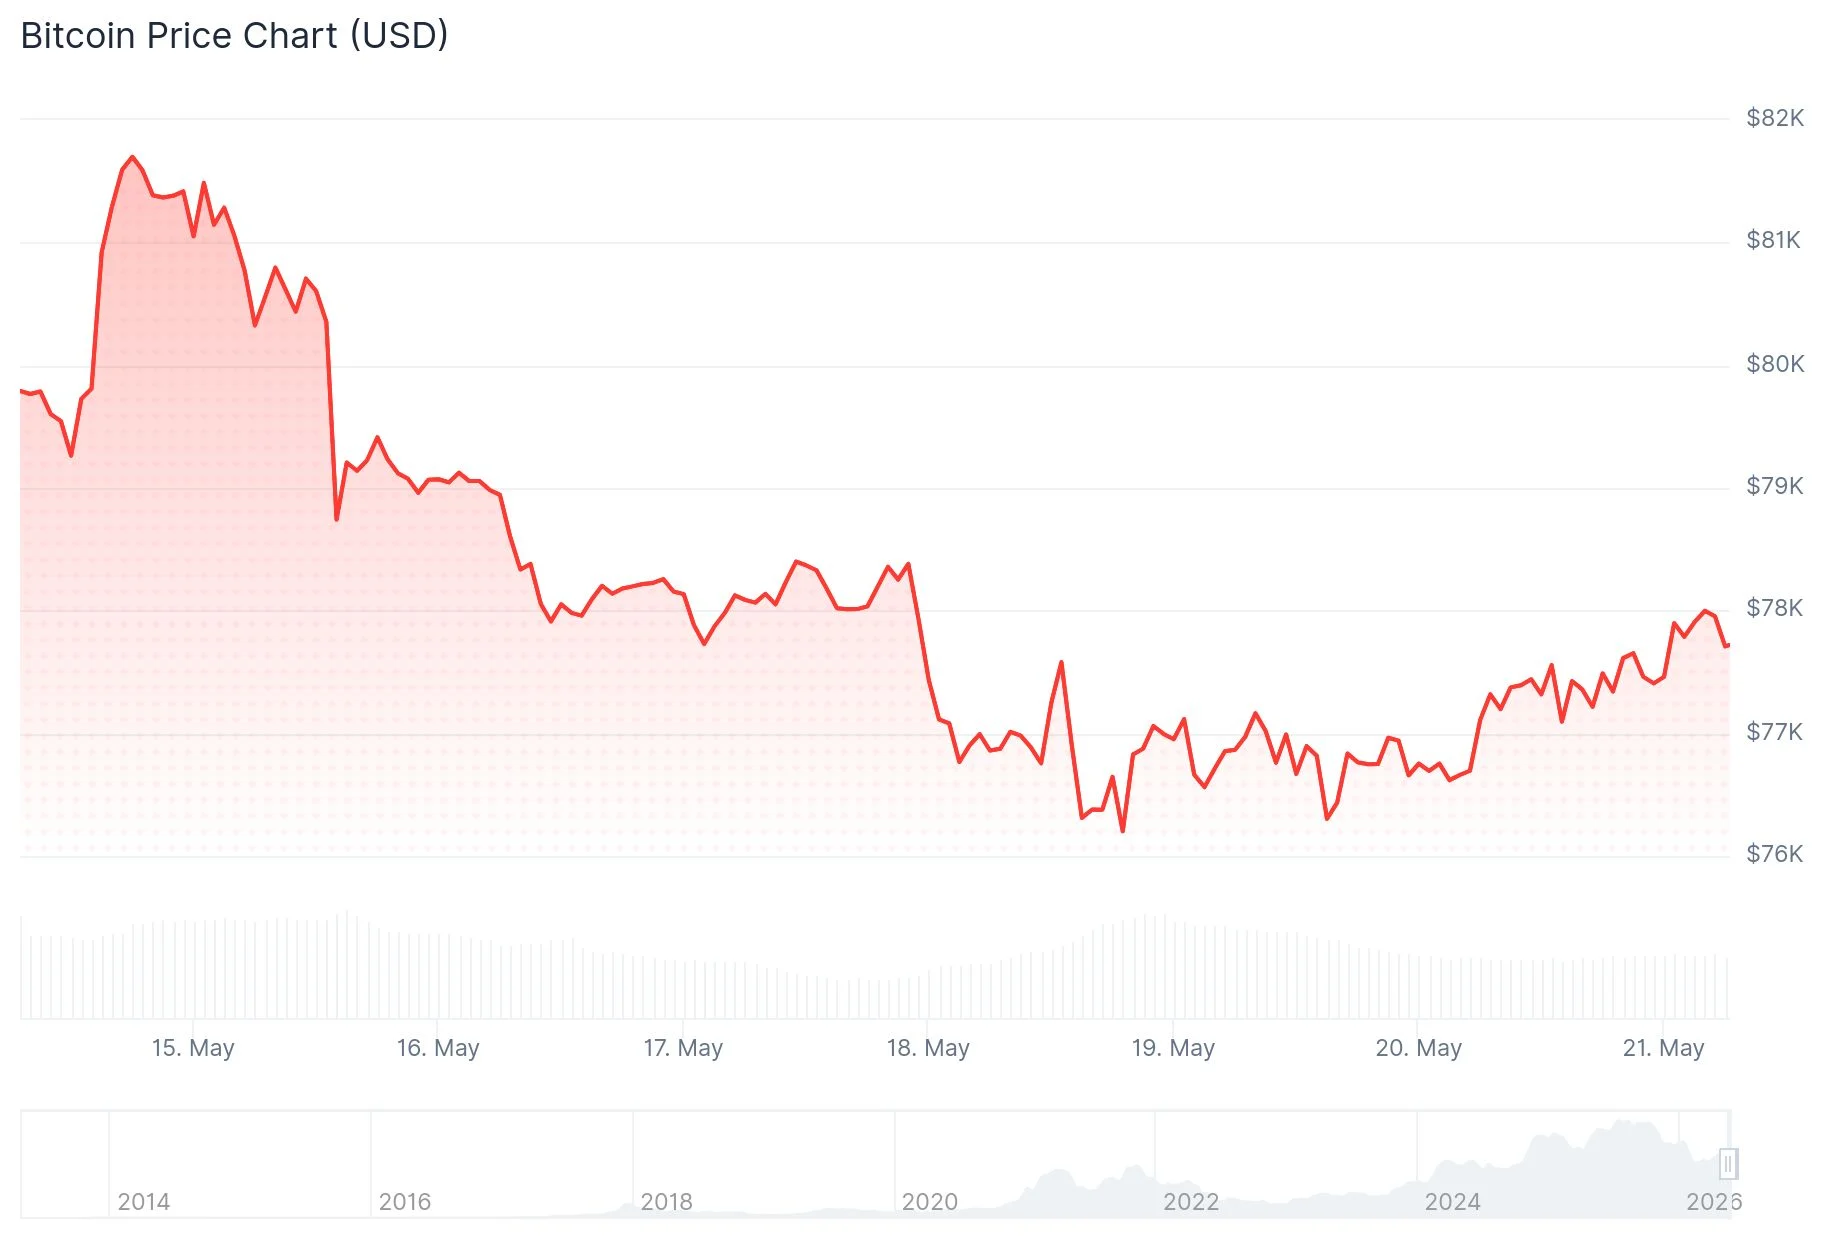
- BTC encountered strong resistance at its 200-day moving average around $82,400, retreating to approximately $77,900.
- The Bull Score Index from CryptoQuant has declined to 20, indicating what the analytics firm calls “extremely bearish” conditions.
- Approximately $2 billion has exited U.S. spot Bitcoin ETFs during the last two weeks.
- Buying pressure from the United States, South Korea, and Hong Kong remains subdued.
- The $70,000 level represents crucial on-chain support should downward pressure persist.
Bitcoin’s recent upward momentum from February’s bottom has encountered significant headwinds. Following its ascent toward the $82,000 mark, the cryptocurrency met formidable resistance at the 200-day simple moving average (SMA) and has subsequently declined to approximately $77,900.
Traders regard the 200-day SMA as a critical technical indicator. This metric frequently serves as the threshold distinguishing authentic market recoveries from temporary relief rallies during bear markets. The inability to penetrate this barrier has sparked debate regarding the sustainability of the recent upward movement.
Market analyst Ali Charts is monitoring the $77,800 threshold with particular attention on shorter timeframes. Ali Charts notes that Bitcoin has established a channel pattern on the 15-minute chart, with $77,800 functioning as the upper boundary. A definitive close beyond this point could trigger movement toward $79,000. Should this level continue acting as resistance, the analyst anticipates a decline toward $76,900 or potentially the $76,000 zone.
Diminishing Demand Emerges as Primary Concern
CryptoQuant, a blockchain analytics platform, identifies deteriorating demand as the principal factor behind the stalled rally. The upward movement during April and early May was propelled by three components: leveraged futures positions, spot market demand, and capital flowing into U.S. ETFs. Each of these drivers has subsequently weakened.
CryptoQuant’s Bull Score Index dropped from 40 down to 20. This reading is characterized by the firm as “extremely bearish,” comparable to measurements recorded during the February-March timeframe when Bitcoin traded within the $60,000 to $66,000 range.

The Coinbase Bitcoin premium—an indicator measuring whether BTC commands higher prices on Coinbase relative to international exchanges—has remained in negative territory throughout much of both the rally and the subsequent decline. Negative readings indicate that American buyers are not actively pushing prices upward.
Capital Flight from ETFs and Subdued Asian Interest
U.S. spot Bitcoin ETFs have transitioned into net outflow territory. Data from SoSoValue indicates the funds experienced approximately $979.7 million in withdrawals during the week concluding May 19, following nearly $1 billion in outflows the preceding week. This reversal follows six consecutive weeks of inflows that provided support for the earlier price appreciation.
Flow data for May 20 revealed Bitcoin ETFs recording $70.5 million in net outflows while Ethereum ETFs witnessed $28.1 million in redemptions, indicating demand has not yet fully stabilized.
South Korea’s kimchi premium, which gauges BTC demand on Korean trading platforms, has slipped into negative territory. Hong Kong’s trio of spot Bitcoin ETFs has registered minimal trading volume throughout May, seldom exceeding several million dollars in combined daily volume.
Should downward price action continue, CryptoQuant identifies $70,000 as the subsequent critical on-chain support zone. This level previously capped rallies during both October and January and currently aligns with the traders’ realized price on-chain.
Bitcoin is currently trading above $77,200 and the 100-hour simple moving average, facing immediate resistance at $78,300 followed by $79,000.
Get 3 Free Stock Ebooks
Discover top-performing stocks in AI, Crypto, and Technology with expert analysis.
- Top 10 AI Stocks - Leading AI companies
- Top 10 Crypto Stocks - Blockchain leaders
- Top 10 Tech Stocks - Tech giants


