
 Price: Critical Fibonacci Level Holds Market’s Attention")
Quick Overview
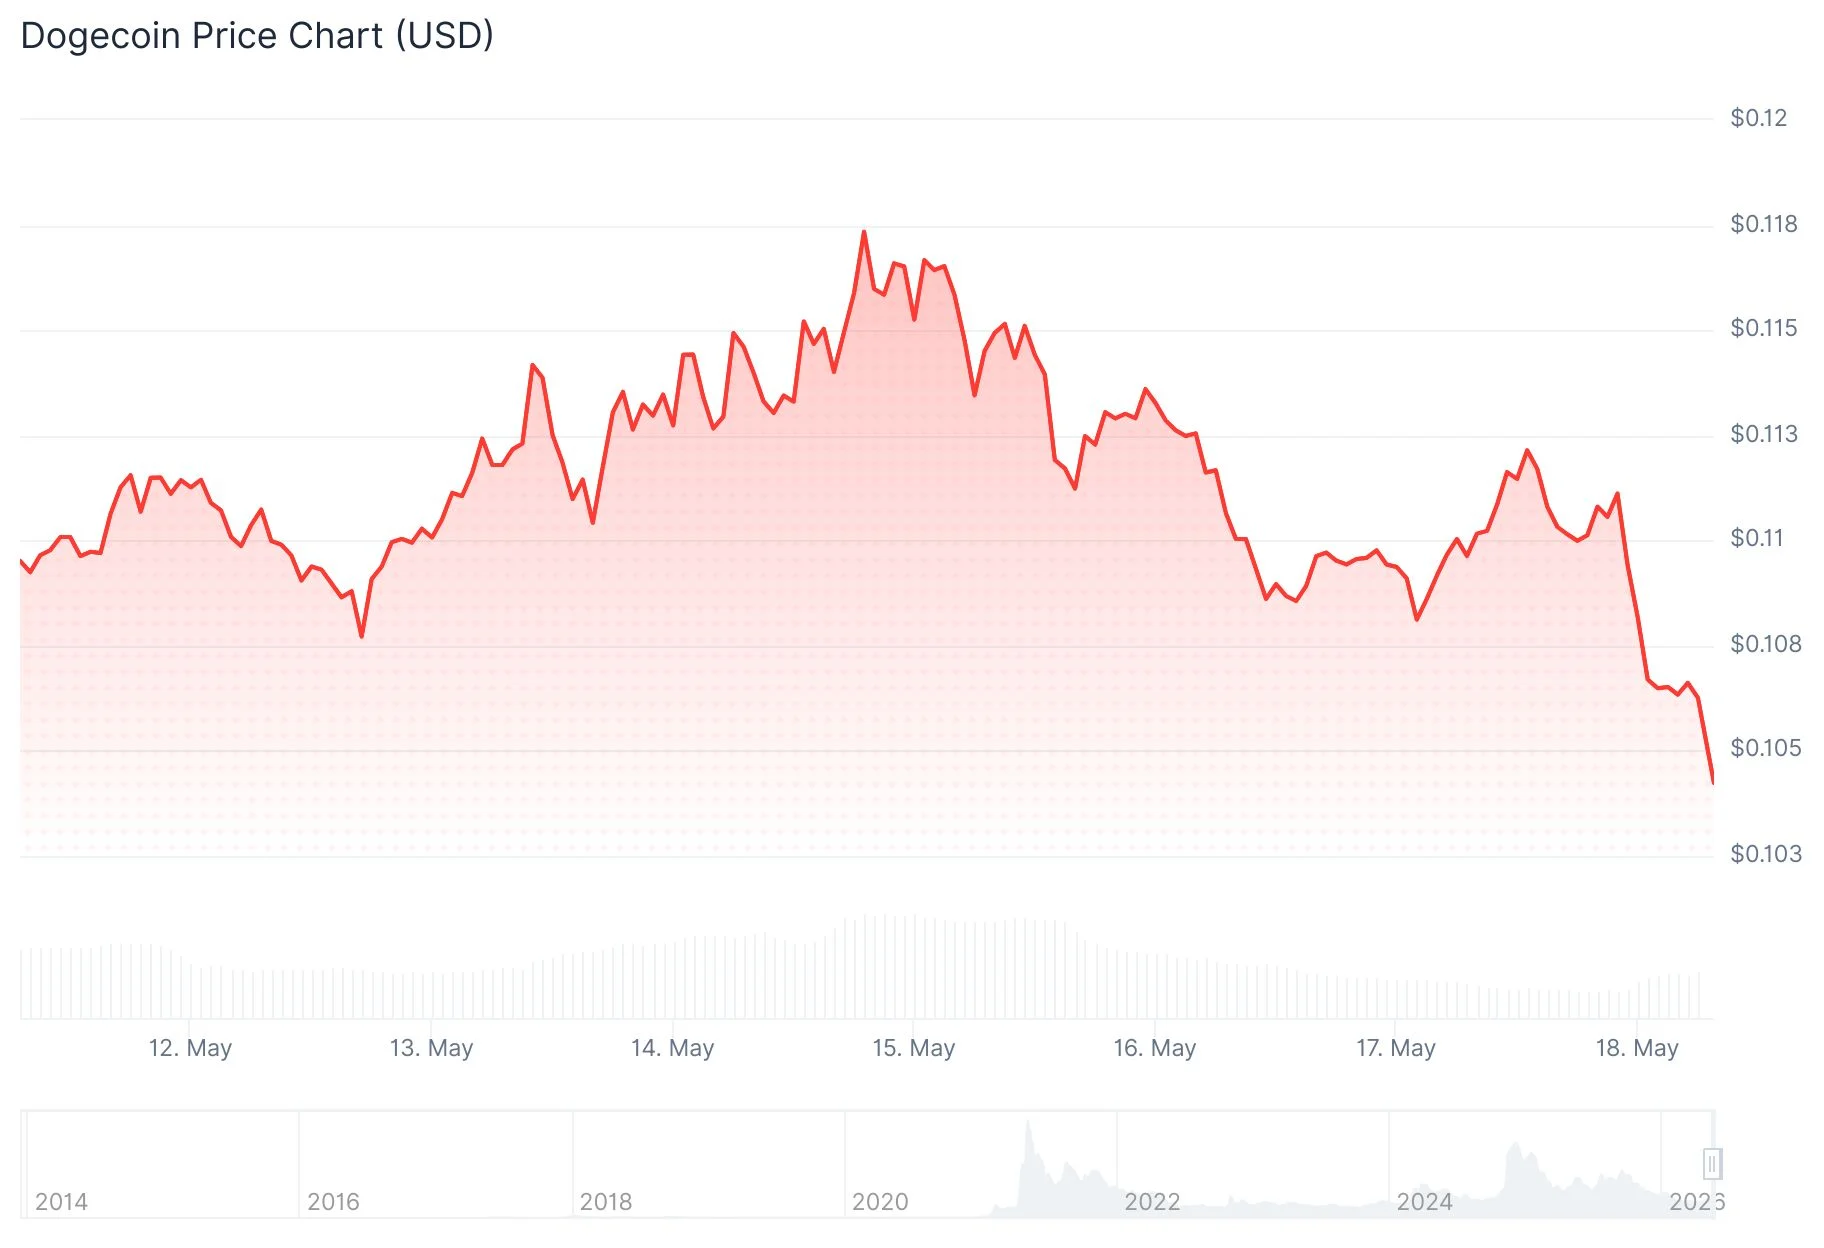
- DOGE currently trades between $0.1102 and $0.1105 with an $18.73 billion market capitalization
- The cryptocurrency is consolidating while approaching the critical 0.618 Fibonacci barrier at $0.11799
- Technical analyst BitGuru identifies a potential rally toward the $0.13–$0.15 zone if bullish pressure intensifies
- Futures market data reveals declining open interest and trading activity, although funding rates remain marginally bullish
- Market observer Cryptollica draws parallels between today’s setup and historical bottom formations from 2015, 2020, and 2022
As of May 17, 2026, Dogecoin is changing hands around $0.1105, registering a modest 1.23% increase over the past 24 hours. The meme cryptocurrency maintains a market capitalization of $18.73 billion while processing $1.29 billion in daily transaction volume.
Recent trading sessions have witnessed primarily lateral price movement. The absence of a decisive directional trend hasn’t stopped market technicians from scrutinizing the current chart formation.
Cryptocurrency technical analyst BitGuru shared his perspective via X on May 17, highlighting that DOGE recently experienced a liquidity sweep before entering its current consolidation phase. According to his analysis, sustained momentum could propel the asset into the $0.13–$0.15 territory. BitGuru emphasized he’s actively monitoring this formation for breakout confirmation signals.
[[EMBED_0]]
Examining the weekly timeframe reveals that DOGE recently found support at the 0.786 Fibonacci level positioned near $0.08042. Following this bounce, the cryptocurrency has retraced toward the 0.618 Fibonacci resistance sitting at $0.11799—a threshold now commanding significant market attention.

Market analyst Surf characterized the current retracement as constructive, suggesting the $0.10 zone should provide adequate support. His assessment draws comparisons to a 2024 pattern where DOGE rebounded from comparable technical levels before initiating a more substantial advance.
Critical Price Zones Under Observation
A confirmed weekly candle close exceeding $0.11799 would constitute a bullish technical development. Should this scenario materialize, subsequent resistance barriers emerge around $0.14 and $0.17 according to the prevailing Fibonacci framework.
Conversely, failure to penetrate this resistance level would shift focus to the $0.095–$0.10 zone as the critical support territory that must maintain.
Historical Cycle Analysis
Analyst Cryptollica presented a macro perspective by aligning current market conditions with previous cyclical bottom formations. His framework categorizes earlier phases as “disbelief” during 2015, “boredom” throughout 2020, and “anger” in 2022. He characterizes the present environment as another sentiment recalibration period, where enthusiasm and trading activity have diminished ahead of potentially stronger price action.
[[EMBED_1]]
While this historical comparison doesn’t forecast an imminent breakout, it provides valuable context regarding DOGE‘s position within longer-term cyclical behavior patterns.
Derivatives market indicators paint a cautious picture. Open interest contracted by 0.79% to $1.52 billion during the previous 24-hour period. Trading volume experienced a sharper decline of 39.17%, settling at $1.62 billion—evidence that numerous market participants are adopting wait-and-see positions.
Despite reduced activity, the funding rate maintains a slightly positive reading of 0.0006%, indicating some leveraged traders continue positioning for near-term appreciation.
DOGE has yet to deliver confirmation of a technical breakout. The 0.618 Fibonacci resistance at $0.11799 stands as the immediate challenge requiring resolution before the next directional move becomes clear.
Get 3 Free Stock Ebooks
Discover top-performing stocks in AI, Crypto, and Technology with expert analysis.
- Top 10 AI Stocks - Leading AI companies
- Top 10 Crypto Stocks - Blockchain leaders
- Top 10 Tech Stocks - Tech giants


