
 Clings to $80K as US Inflation Surges to Three-Year Peak")
Key Takeaways
- April’s US inflation rate climbed to 3.8% annually, marking the steepest rise since May 2023
- Surging energy costs, fueled by geopolitical tensions, contributed more than 40% to the monthly uptick
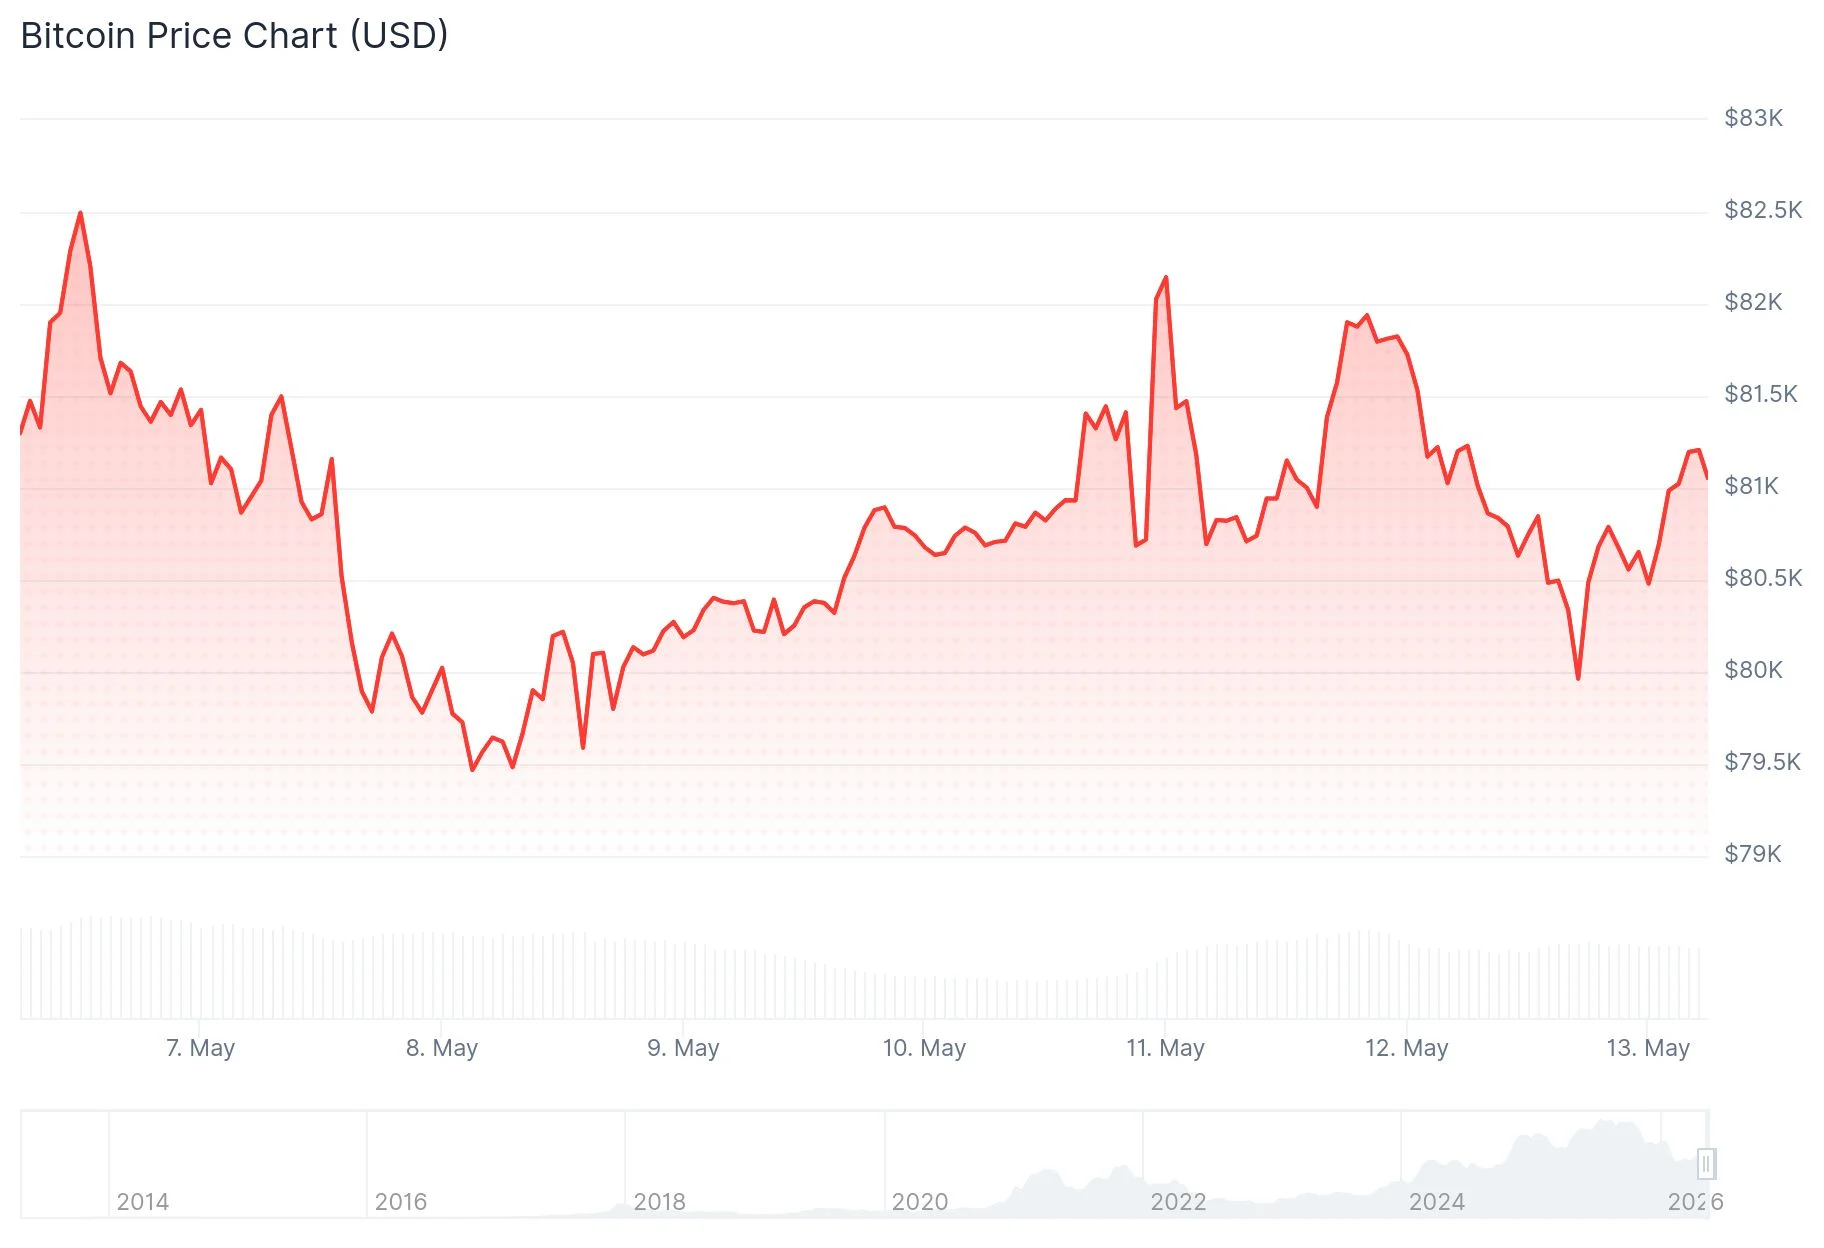
- BTC maintained support around $80,000 while facing strong resistance between $82,000 and $82,600
- The 200-day simple moving average near $82,600 presents a critical hurdle for bullish momentum
- Bitcoin ETFs recorded capital outflows while the Coinbase Premium Index remained in negative territory
Bitcoin maintained its position around the $80,000 threshold on Tuesday following the release of April’s Consumer Price Index data, which showed inflation accelerating to 3.8% on an annual basis—the most elevated reading witnessed since May 2023.
The month-over-month figure registered at 0.6%, aligning with analyst expectations. Core inflation, excluding volatile food and energy components, increased 0.4% monthly and 2.8% year-over-year.
Energy sector inflation dominated the headline number. According to the Bureau of Labor Statistics, energy prices jumped 3.8% throughout April, accounting for over 40% of the entire monthly advance. On a twelve-month basis, energy prices have surged nearly 18%.
The escalating conflict between the United States and Iran, coupled with constrained oil supplies, continues to push energy prices upward.
Crypto analyst Daan Crypto Trades observed on X that Bitcoin remains “still fighting the Daily 200MA/EMA and November lows,” identifying this zone as “the level to break for the bulls to see further upside into the mid/high $80Ks.”

BTC Trapped Between Critical Support and Resistance Zones
Bitcoin hovered around $80,681 throughout trading hours, touching an intraday bottom near $80,415. Each rally attempt toward $82,000 encountered aggressive selling pressure.
Market analysis platform Material Indicators pinpointed the 200-day simple moving average around $82,600 as a formidable resistance barrier. The firm observed that buyers appear to be consolidating support at $80,700 in preparation for another breakout attempt.
Cryptocurrency analyst Michaël van de Poppe highlighted the 21-day SMA at $78,800 as a critical technical marker. He emphasized that $76,000 represents a support threshold that must hold, cautioning that a breakdown below this level could trigger “substantially lower” price action.
The Coinbase Bitcoin Premium Index has persisted in negative territory throughout recent trading sessions—a pattern that generally indicates diminished US institutional demand relative to international trading platforms.
Bitcoin ETF Withdrawals and Federal Reserve Ambiguity Weigh on Sentiment
Spot Bitcoin exchange-traded funds experienced capital withdrawals during recent sessions, diminishing immediate buying pressure.
Treasury yields climbed following the inflation report, while equity index futures retreated as market participants recalibrated monetary policy expectations. The Federal Reserve’s stated 2% inflation objective remains considerably distant from today’s 3.8% reality.
The CME FedWatch Tool indicates market consensus expects interest rates to remain stable through 2026 and beyond. However, according to The Kobeissi Letter, probability assessments for potential rate increases have been gradually climbing.
Kevin Warsh’s Federal Reserve chairman nomination advanced past a significant Senate checkpoint this week, introducing additional uncertainty into financial markets.
Bitcoin’s trajectory in the coming sessions hinges on whether demand can preserve the $80,000 floor. A decisive daily close above $82,000 would alleviate near-term bearish momentum.
Get 3 Free Stock Ebooks
Discover top-performing stocks in AI, Crypto, and Technology with expert analysis.
- Top 10 AI Stocks - Leading AI companies
- Top 10 Crypto Stocks - Blockchain leaders
- Top 10 Tech Stocks - Tech giants


