
 Price Maintains $2,300+ Support Despite Retail Exodus and Whale Buying Spree")
Key Highlights
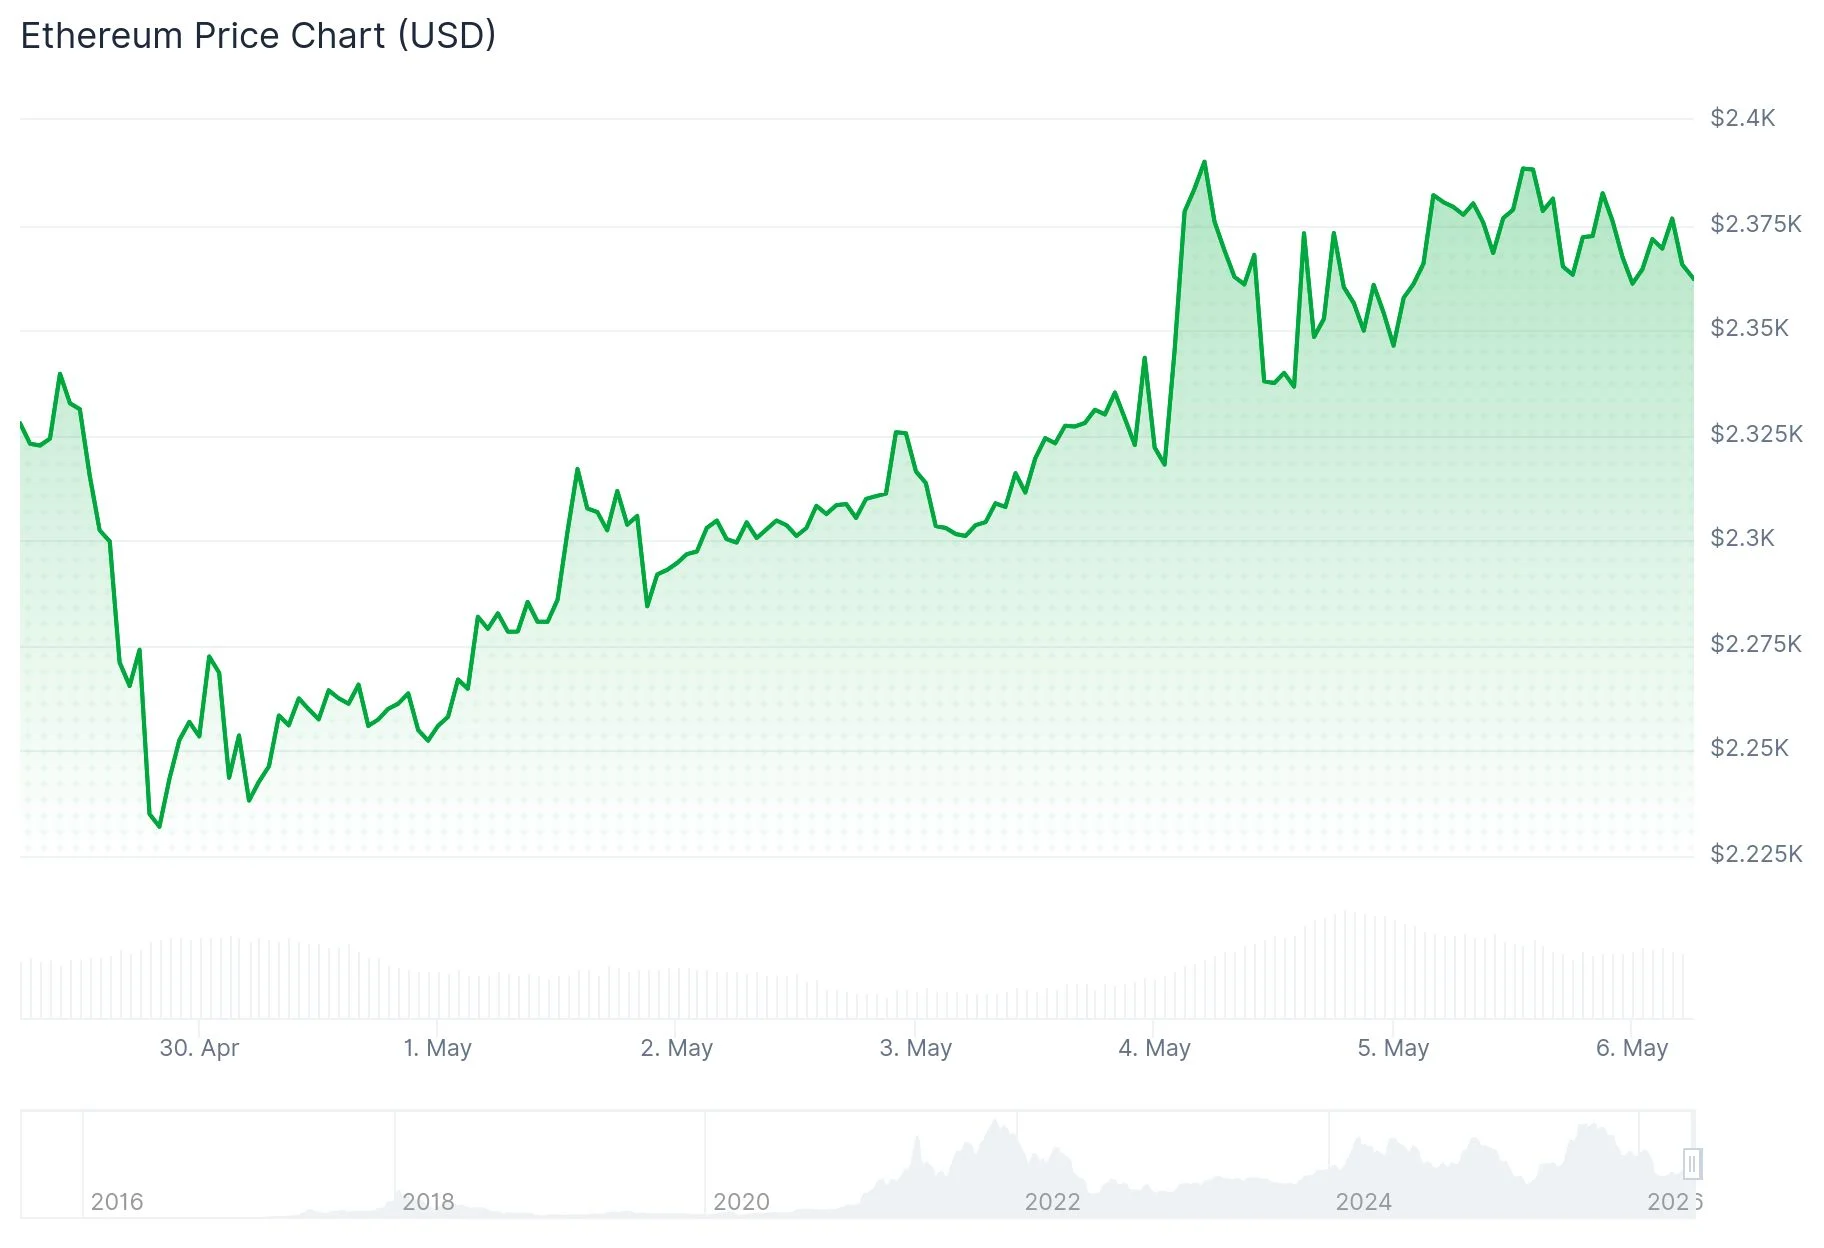
- Ethereum trades between $2,370 and $2,380, posting gains of 0.8% daily and exceeding 3% weekly growth
- Smaller holders have offloaded approximately 1.5 million ETH during a two-week period
- Large wallet addresses purchased 230K ETH in the previous week, offsetting retail distribution
- April witnessed exchange outflows drop to their lowest point in eight months, reflecting cautious sentiment
- Critical resistance zones await at $2,388–$2,400, while the 200-period simple moving average stands at $2,680
Ethereum maintains its position above the $2,300 threshold this Tuesday, with current trading activity centered around the $2,370–$2,380 range. The digital asset has registered a 0.8% increase over 24 hours and has climbed more than 3% across the previous seven days.
While the weekly performance appears positive on the surface, underlying blockchain data reveals a more complex narrative.
Addresses containing between 100 and 10,000 ETH have liquidated roughly 820K coins during the most recent week. Extending the timeframe to two weeks reveals that this segment has distributed nearly 1.5 million ETH.
The 90-day Mean Coin Age indicator has experienced a notable decline. This movement indicates that recent sellers are predominantly shorter-term participants rather than established long-term holders.
Staking withdrawal activity reinforces this pattern. Approximately 300K ETH exited staking protocols last week — marking the highest weekly unstaking volume since November.

In derivatives markets, perpetual futures funding rates for ETH have stayed in negative territory throughout most of the last 30 days. Though open interest has climbed above 14 million ETH, futures market sentiment continues to reflect uncertainty.
Large Holders Counter Retail Distribution
As smaller wallets exit positions, major holders have adopted a contrarian approach. Whale addresses accumulated roughly 230K ETH during the past week, providing a counterbalance to retail selling pressure.

Ethereum experienced $38.7 million in forced liquidations during the last 24-hour period. Short position liquidations accounted for $26.1 million of this total, contributing to upward price momentum.
Market observer Ali Charts identified a golden cross pattern developing between the 50 and 100-period simple moving averages on Ethereum’s chart, suggesting potential movement toward the 200 SMA positioned at $2,680. Conversely, analyst Ted Pillows adopted a more reserved perspective, highlighting that ETH has repeatedly failed to surpass $2,400 and warning that downside exposure persists until that barrier is overcome.
Exchange Outflows Reach Eight-Month Minimum
April data shows ETH withdrawals from centralized exchanges declined to levels not observed since September 2024. Approximately 19.8 million ETH departed exchange platforms throughout the month. Binance recorded the highest outflows at 7.09 million ETH, with OKX following at 2.4 million and Coinbase Prime at 1.62 million.
The reduction in withdrawal activity implies that certain investors are choosing to maintain ETH on exchange platforms instead of transferring assets to self-custody solutions. This behavior reflects a cautious, observational stance rather than definitive long-term conviction.
Technical analysis reveals ETH has successfully recaptured the $2,200–$2,300 support territory and established consecutive higher lows since February. The 50-week and 100-week moving averages occupy the $2,500–$2,800 zone, currently functioning as overhead resistance.
Ethereum continues testing the $2,388 resistance threshold. Current valuation remains beneath both the 50-week and 100-week moving average indicators.
Get 3 Free Stock Ebooks
Discover top-performing stocks in AI, Crypto, and Technology with expert analysis.
- Top 10 AI Stocks - Leading AI companies
- Top 10 Crypto Stocks - Blockchain leaders
- Top 10 Tech Stocks - Tech giants


