
 Revisits Critical Support Level That Previously Fueled 2,200% Surge")
Quick Overview
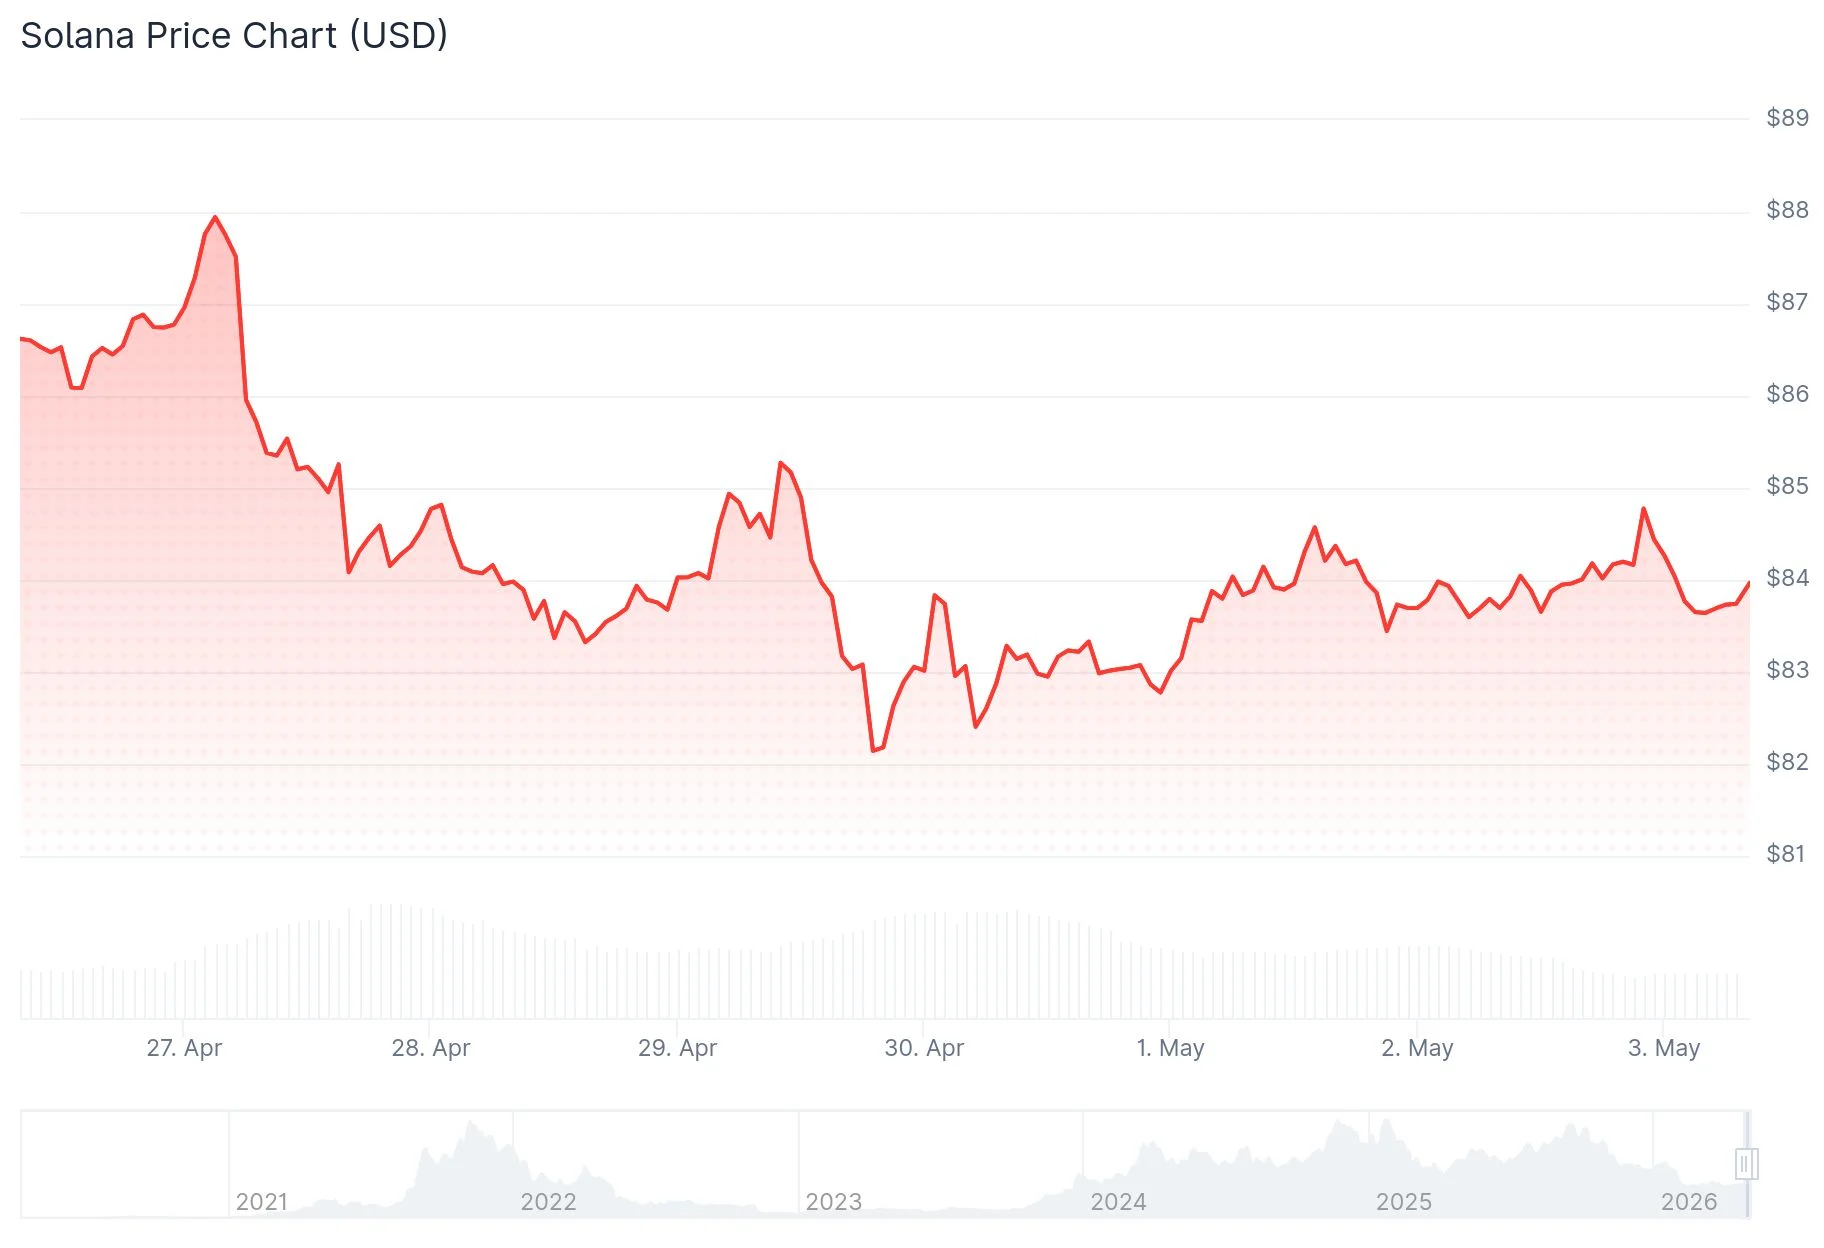
- Solana currently trades within the $80–$85 range, a historically significant support level that previously initiated major price rallies.
- Liquidation data reveals increasing short position concentration between $84 and $87.
- Breaking above $106.24 represents the critical threshold for confirming renewed bullish momentum.
- Technical analyst Crypto Patel highlights that SOL has returned to the identical accumulation zone that generated a 2,200% increase in the previous cycle.
- Chart patterns reveal a substantial triangle formation that could propel prices toward $250–$300 if current support levels maintain.
Solana is currently positioned within the $80 to $85 price range at press time, a critical zone that has demonstrated significant importance throughout previous market cycles. The cryptocurrency has experienced a decline exceeding 70% from its 2025 peak values before stabilizing in this current range.
This price region holds historical precedent for Solana. During 2021, SOL surged from single-digit levels to surpass $250. Following a significant correction in 2022 that brought prices down to approximately $10, the asset reconstructed its foundation and subsequently climbed to fresh peaks approaching $290 in the following market cycle.
Crypto Patel, a prominent technical analyst on X, specifically highlighted this observation. In a recent social media update, Patel stated: “$SOL is back at the same buy zone that pumped it 2,200% last cycle. Will it hit $1000 in alt season?” The commentary references a recurring pattern across multiple market cycles where this specific price territory functioned as a springboard for substantial upward movements.
Critical Price Levels Under Observation
Liquidation data for SOL published by CoinAnk indicates accumulating short positions within the $84 to $87 corridor. The price briefly touched approximately $81 before recovering toward that upper concentration area. These heatmaps identify price levels where leveraged traders face potential forced liquidations.
Analyst Don published technical analysis identifying $106.24 as the subsequent crucial resistance level that Solana must reclaim. Without successfully clearing this threshold, the chart structure fails to confirm a legitimate restoration of bullish market conditions. Beyond the $106 barrier, an additional target exists at $260.17, though that objective remains considerably distant under current conditions. Should buyers prove unable to maintain the present support zone, technical projections suggest a potential retreat to $80 or lower levels.

Converging Triangle Formation Builds Tension
Analyst Javon Marks presented chart analysis displaying SOL confined within an extensive triangle consolidation pattern. This technical structure exhibits progressively lower peaks and higher troughs developing across an extended timeframe, which characteristically compresses price action before generating a more substantial directional move.
Solana is presently positioned near the lower boundary of this triangle formation, approximately within the $75 to $85 range. Should buyers successfully protect this support level, breakout projections target the $250 to $300 zone. Conversely, a breakdown beneath the mid-$60s would compromise the pattern’s integrity and bring the $45 area into consideration.
As of this writing, SOL continues to maintain position within its current support corridor between $80 and $90, with $106.24 standing as the next significant resistance level that bulls must overcome.
Get 3 Free Stock Ebooks
Discover top-performing stocks in AI, Crypto, and Technology with expert analysis.
- Top 10 AI Stocks - Leading AI companies
- Top 10 Crypto Stocks - Blockchain leaders
- Top 10 Tech Stocks - Tech giants


