
 Price Forecast: Critical Support Zone Tested as May Volatility Looms")
Key Takeaways
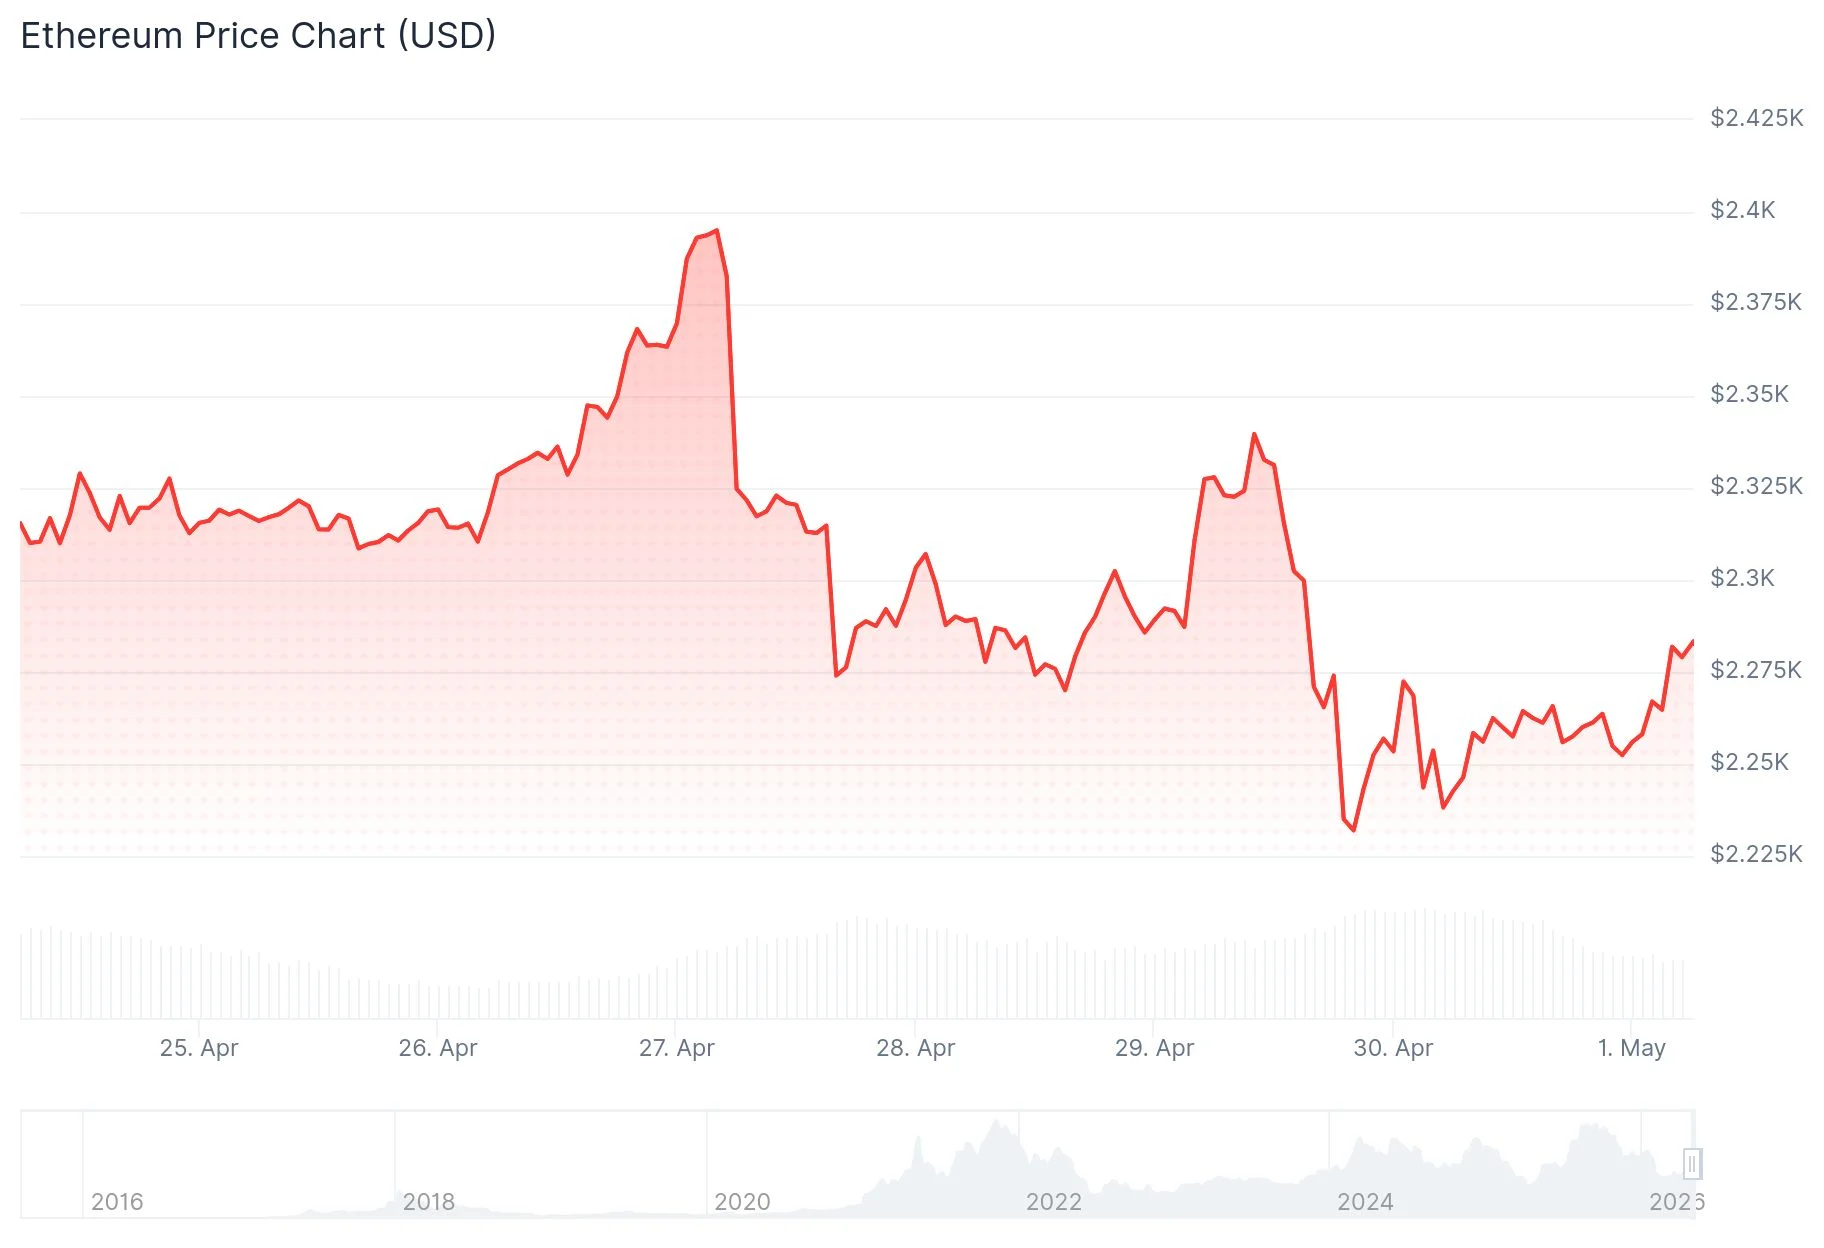
- Ethereum currently sits near $2,260, pressured by elevated US inflation readings and broader market uncertainty.
- Derivatives indicators reveal negative taker buy-sell ratios alongside negative funding rates, signaling short-term bearish sentiment.
- Technical analyst Ted Pillows highlights $2,150–$2,200 as a pivotal zone where a breakdown could accelerate selling pressure.
- Binance-specific data contradicts broader trends, showing aggressive buying with taker buy-sell ratios exceeding 1.
- Historical patterns indicate May traditionally brings extreme volatility to Ethereum, with potential for significant price swings.
Ethereum continues to hover around the $2,260 mark as macroeconomic pressures and conflicting derivatives signals create uncertainty for the month ahead.
March’s US Personal Consumption Expenditures (PCE) Price Index registered a 3.5% year-over-year increase, a notable jump from February’s 2.8%. The core PCE reading, which serves as the Federal Reserve’s primary inflation gauge, reached 3.2% — marking the highest reading since November 2023. Such elevated inflation data diminishes expectations for near-term interest rate reductions, typically dampening enthusiasm for risk assets including cryptocurrencies.
Additional pressure stems from escalating geopolitical tensions in the Middle East, contributing to widespread caution across global financial markets.
Futures market analysis reveals the taker buy-sell ratio has slipped into negative territory. This indicator measures the balance between aggressive buyers and sellers executing market orders on perpetual contracts. The 14-day moving average has demonstrated consistent decline since mid-April.

Concurrently, ETH funding rates have maintained negative values throughout this timeframe. When funding rates turn negative, short sellers compensate long position holders, indicating prevailing bearish sentiment among derivatives traders.

Open interest has stabilized around 13.5 million ETH, representing a decrease from the 14.4 million ETH recorded on April 18. This contraction implies traders are reducing exposure rather than establishing fresh positions.
Critical Price Thresholds Under Scrutiny
Technically, ETH is positioned beneath its 20-day exponential moving average at $2,287 and the 100-day EMA near $2,365. The Relative Strength Index remains anchored around the neutral 50 level, while the Stochastic Oscillator has entered oversold conditions.
Ethereum’s realized price — representing the aggregate on-chain acquisition cost — stands at $2,308, functioning as a resistance barrier. Repeated failures to surpass this threshold indicate holders are liquidating positions near their break-even points.
Immediate support exists at $2,211, with the 50-day EMA providing additional defense near $2,244. Should these levels fail, subsequent support zones emerge at $2,108, $1,909, and $1,741.
Market analyst Ted Pillows identified the $2,150–$2,200 range as a decisive battleground, warning that a breach below this area could trigger “accelerated dumping.” He views this zone as a potential foundation for renewed upward momentum.
Liquidation data shows $38.2 million in forced position closures over the past 24 hours, with short positions accounting for $19.5 million of this total.
Exchange-Specific Data Reveals Bullish Undertones
Contrary to broader market indicators, Binance-specific data presents a more optimistic picture. The taker buy-sell ratio on this exchange exceeds 1, according to CryptoQuant analysis shared by Rei Researcher. This divergence suggests Binance traders are demonstrating more aggressive buying behavior compared to the wider market.
Open interest on Binance has experienced modest increases from recent lows, indicating gradual accumulation of long positions. Nevertheless, overall leverage expansion remains constrained, which mitigates the risk of cascading liquidation events.
Historical May Volatility Patterns
Data compiled by CoinGlass reveals May consistently ranks among Ethereum’s most volatile calendar months. Both average and median return figures for May occupy the extremes when compared to other months — characterized by amplified gains and losses.
Trader Daan Crypto Trades emphasized this historical tendency, observing that May typically delivers dramatic price movements rather than gradual directional trends.
As May 2026 commences, ETH is positioned near $2,261, entering what historically proves to be one of its most unpredictable trading periods.
Get 3 Free Stock Ebooks
Discover top-performing stocks in AI, Crypto, and Technology with expert analysis.
- Top 10 AI Stocks - Leading AI companies
- Top 10 Crypto Stocks - Blockchain leaders
- Top 10 Tech Stocks - Tech giants


