
 Price Analysis: Will $80 Support Hold or Is $60 the Next Stop?")
TLDR
- Solana currently trades between $83 and $85 following a 3%+ decline over 48 hours, positioned beneath all significant moving averages.
- Technical analysts identify a completed head and shoulders formation on longer timeframes, with the breached neckline at $110–$120 converting to resistance.
- The $80 price level represents crucial support; failure to maintain this threshold could trigger moves toward $75 or $70.
- Derivative market indicators display mild bullish sentiment with a 1.08 long-to-short ratio and positive funding rates.
- Long-horizon strategists identify accumulation opportunities in the $50–$80 range, projecting potential rallies to $500–$1,000 upon reclaiming $100.
Solana faces persistent downward pressure as April 2026 draws to a close. Currently priced around $84.58, the asset remains trapped beneath its 50-day, 100-day, and 200-day exponential moving averages. These technical barriers—positioned at approximately $86.72, $95.36, and $115.06 respectively—have transformed into formidable resistance zones.
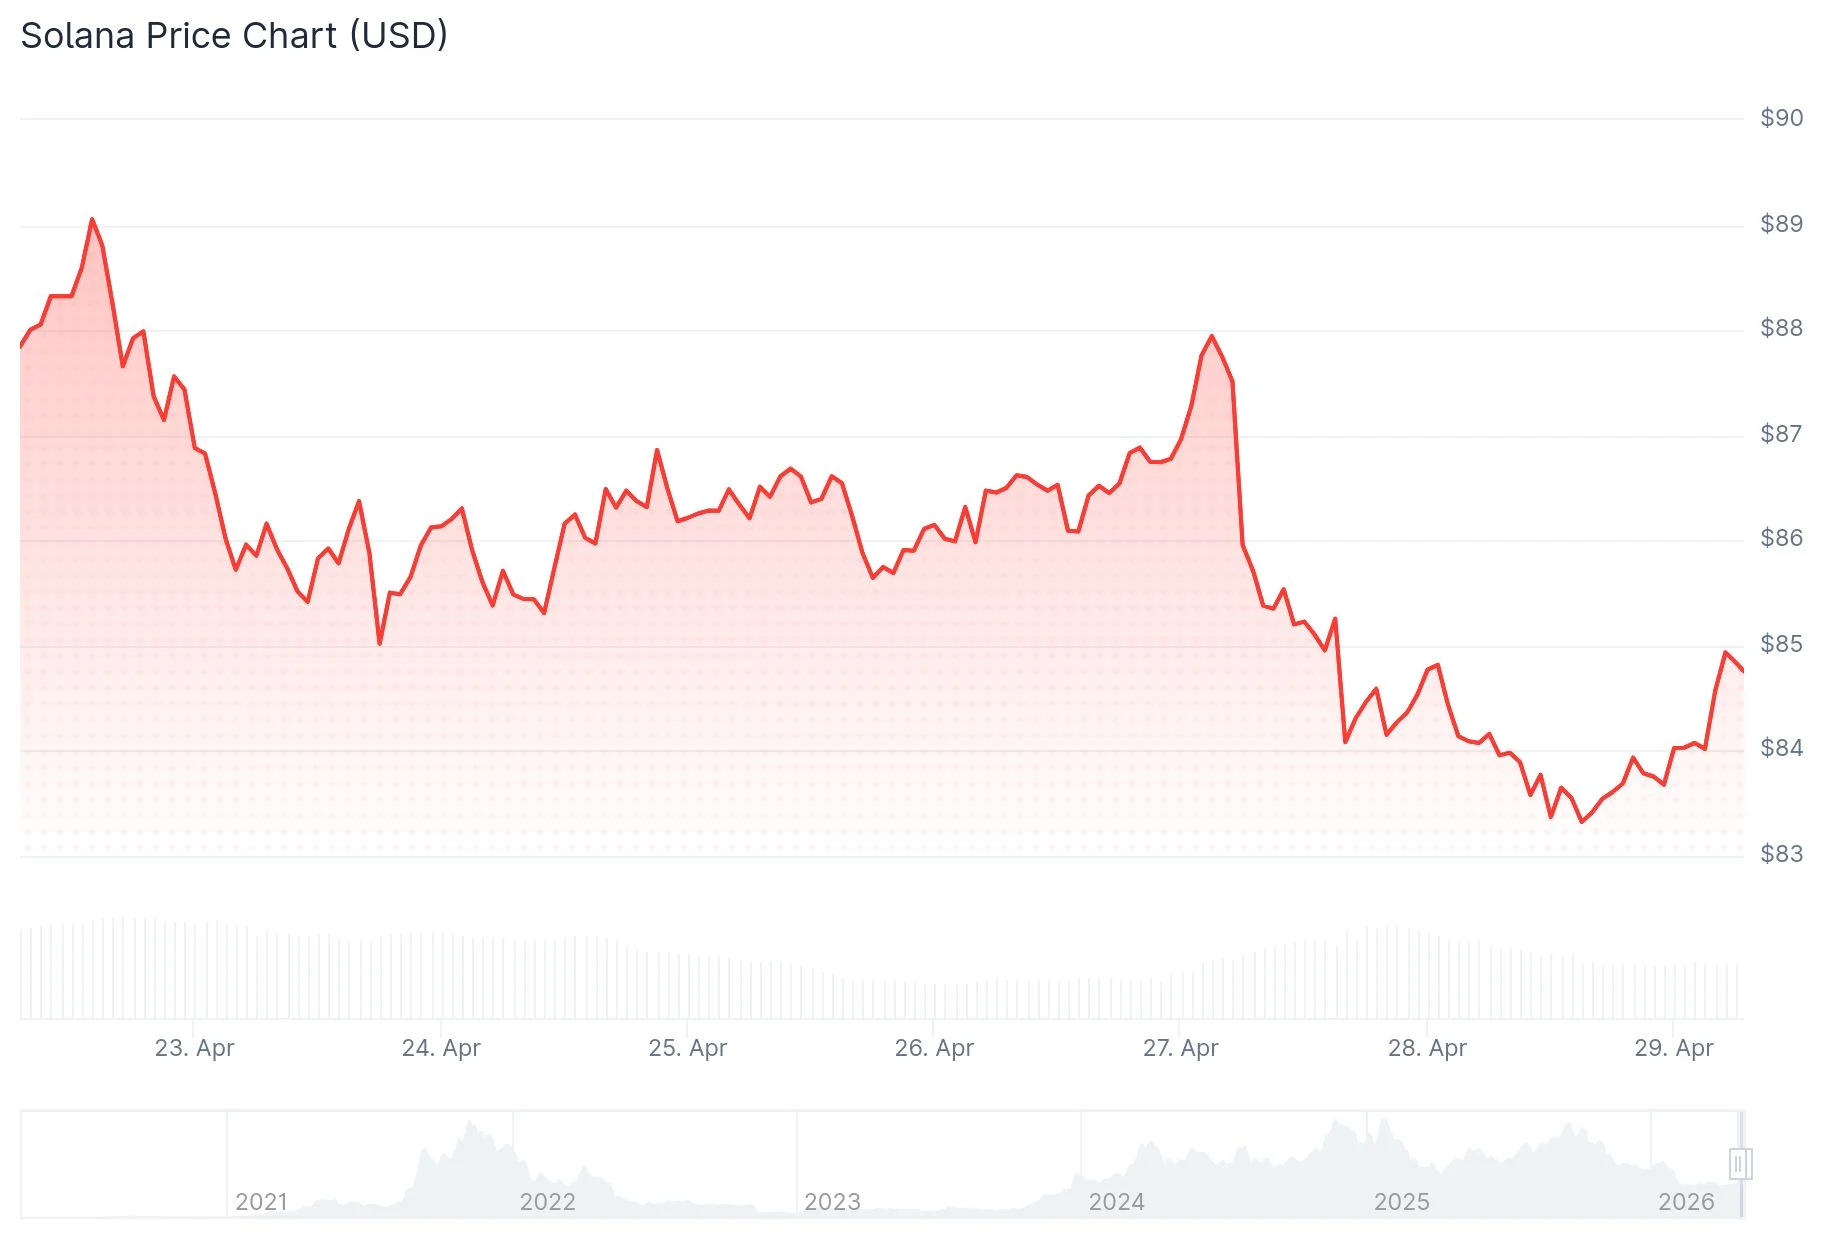
The cryptocurrency has shed more than 3% of its value across the previous two trading sessions. Market sentiment remains uncertain, with limited buying enthusiasm evident at present price points.
Market analyst Crypto Tony highlighted Solana’s inability to sustain momentum above the $85–$88 resistance corridor. The chart continues displaying progressively lower peaks, a classic indicator of deteriorating bullish strength. A recent rejection near the $90 mark confirmed ongoing seller dominance within that territory.
The $80 threshold represents the immediate critical support. Should this level fail, market observers anticipate continued weakness toward $75, with $70 serving as the subsequent target.
Bearish Head and Shoulders Formation Suggests Further Decline
Technical analyst Mister Crypto has documented a head and shoulders configuration developing across extended timeframes. This pattern has reached completion, with price action breaking beneath the neckline region spanning $110 to $120.

This violated neckline now functions as a resistance barrier. While a retest of this zone remains possible, rejection at that level would likely accelerate downward movement. Projected downside objectives under this scenario encompass $80 with extended risk toward $60.
Only a decisive close above $120 would invalidate this bearish configuration and reestablish positive momentum for the digital asset.
Derivative Metrics Show Modest Optimism Despite Mixed On-Chain Data
Contrary to the subdued price performance, certain derivatives indicators present a moderately optimistic perspective. According to CoinGlass analytics, Solana’s long-to-short ratio stands at 1.08—representing the highest reading in more than 30 days. The open interest-weighted funding rate similarly transitioned to positive territory on Tuesday at 0.0018%. These metrics indicate traders maintain a slight preference for long exposure.

Solana’s official X platform announced Tuesday that its Real World Assets infrastructure achieved a record $2.5 billion in aggregate value. This achievement demonstrates expanding blockchain utilization despite price headwinds.
Conversely, Santiment’s social dominance indicator for SOL declined to merely 0.55%. Reduced social engagement typically signals diminishing retail participation. Spot ETF inflows have remained stagnant throughout the current week, with minimal institutional capital deployment observed.
Analyst Crypto Patel adopts an extended timeframe perspective, observing SOL’s transition from downtrend into broad consolidation territory. The $80 area corresponds with Fibonacci support parameters. More substantial demand zones exist between $50 and $70, where strategic long-term accumulation may materialize. Patel anticipates a potential liquidity sweep into this lower range preceding any substantial upward movement. Extended-term projections envision SOL reaching $500 or potentially $1,000, contingent upon definitively reclaiming the $100 level.
As of Wednesday’s trading session, SOL remains beneath the 23.6% Fibonacci retracement at $86.67, with the RSI indicator hovering near 48 and MACD showing slight negative divergence—reflecting cautious market dynamics rather than catastrophic failure.
Get 3 Free Stock Ebooks
Discover top-performing stocks in AI, Crypto, and Technology with expert analysis.
- Top 10 AI Stocks - Leading AI companies
- Top 10 Crypto Stocks - Blockchain leaders
- Top 10 Tech Stocks - Tech giants


