
 April Analysis: Price Struggles Amid $285M Hack and TVL Crash")
Key Takeaways
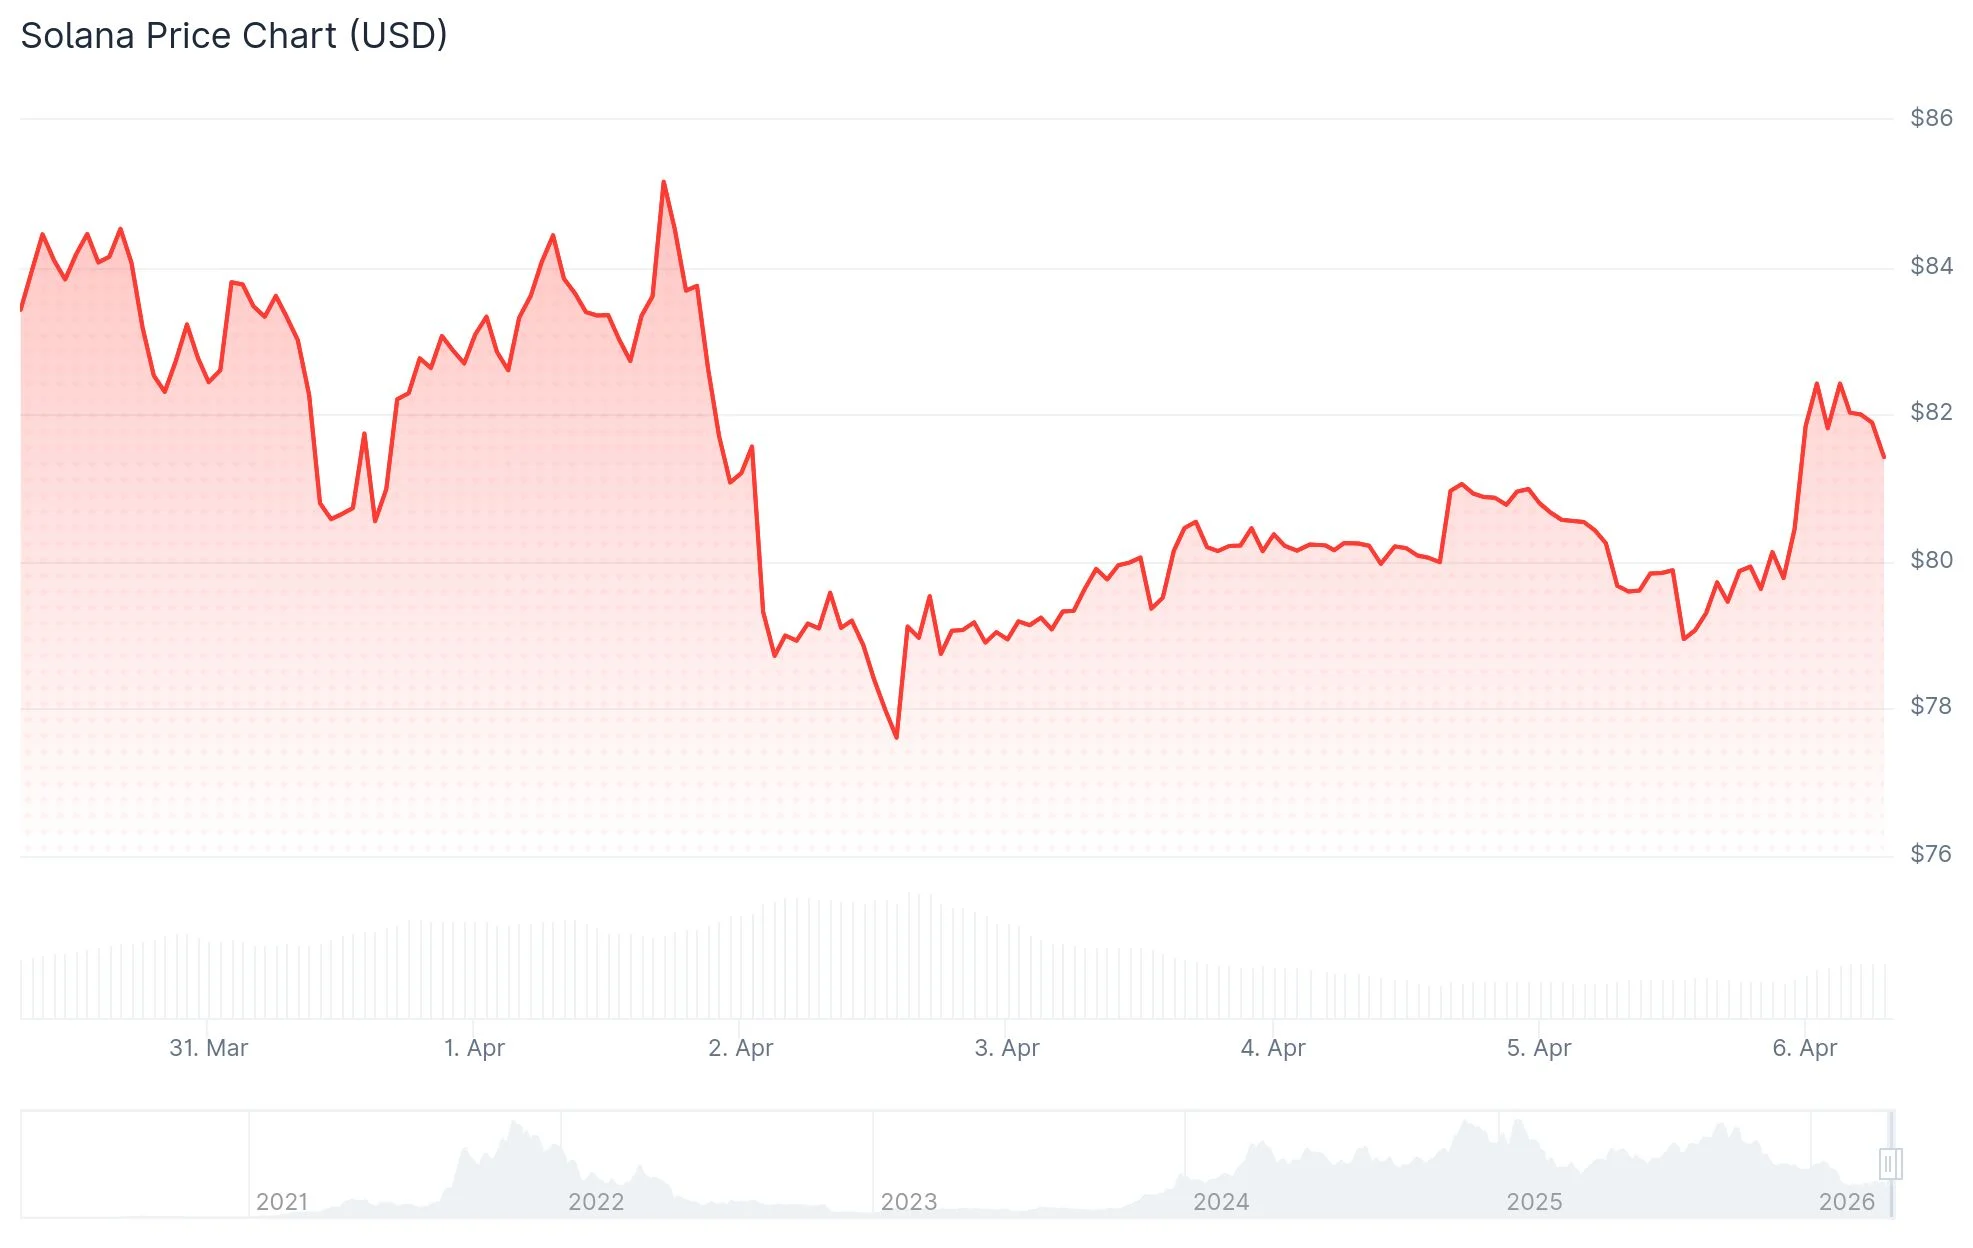
- SOL currently fluctuates between $78–$82, fighting to maintain critical support between $75–$78
- The Drift Protocol suffered a devastating $285 million security breach that has undermined ecosystem trust
- Total value locked on Solana has plummeted from $9 billion to approximately $5.5–$6 billion recently
- Exchange deposits surged by 1.40 million SOL (approximately $110 million) within 72 hours, signaling potential sell pressure
- Institutional interest remains tepid with SOL ETFs posting $5.24 million in net outflows for the second week running
Solana faces mounting challenges following several damaging events that have rocked the ecosystem consecutively. The token has declined roughly 1.5%, currently changing hands in the $78 to $82 range.
The primary catalyst behind the downturn stems from the $285 million security breach at Drift Protocol, a decentralized finance platform operating on Solana, which transpired on April 1, 2026. Intelligence sources connected North Korean threat actors to the incident. Drift’s total value locked plummeted catastrophically from $530 million to $230 million in less than 24 hours.
This security incident has seriously damaged credibility throughout Solana’s wider ecosystem. Market participants are now conducting thorough risk assessments of protocols operating on the blockchain.
Declining TVL Indicates Substantial Capital Flight
According to DeFiLlama tracking data, Solana’s aggregate TVL has contracted from over $9 billion to somewhere between $5.5–$6 billion over recent weeks. This magnitude of contraction represents genuine capital withdrawal from the network, not merely token price fluctuations.
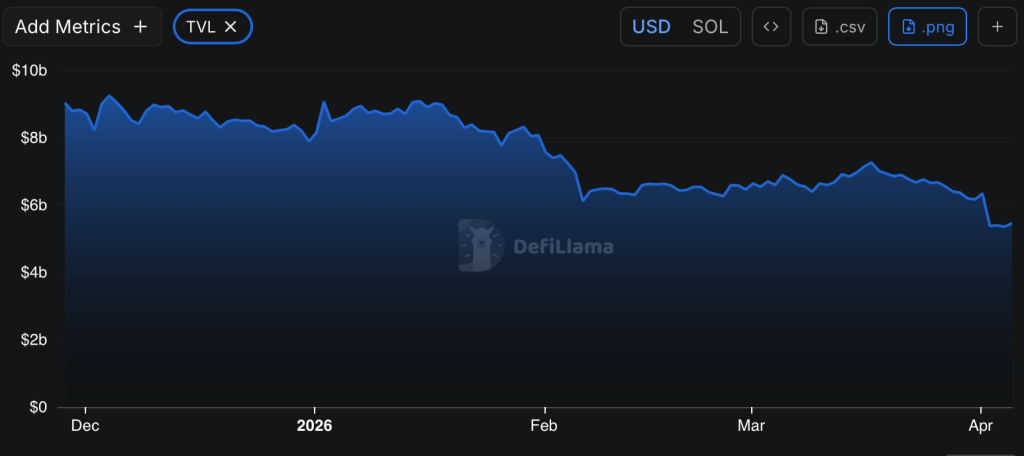
When total value locked contracts, it demonstrates that users are pulling funds from DeFi protocols. This dynamic also creates barriers for fresh capital entry, as market sentiment deteriorates.

Blockchain analytics from Glassnode, highlighted by analyst Ali Charts, reveals that 1.40 million SOL tokens valued at roughly $110 million transferred to centralized exchanges during a 72-hour period. Exchange-held balances increased from 26.5 million SOL on March 31 to 28.6 million by April 2. Elevated exchange balances often foreshadow selling activity, although they don’t guarantee it definitively.
Critical Technical Zones Under Observation
Solana is presently challenging a support band ranging from $75 to $78. The asset has rebounded from this region previously, but consecutive tests without decisive upward momentum gradually erode support strength.
The Relative Strength Index registers approximately 44, beneath the neutral threshold, while the MACD indicator remains in bearish territory. Both metrics indicate subdued momentum. The 50-day exponential moving average stands at $88.80 and represents the initial resistance barrier SOL must overcome for any significant upward movement.
Market analyst Crypto Patel published a longer-term chart positioning SOL near a Fibonacci retracement support corridor between $61.75 and $42.62. The analysis identifies a possible accumulation zone should current levels hold, referencing SOL’s prior 2,194% surge from 2022 bottoms. Nevertheless, Crypto Patel emphasized that the chart’s $1,000+ long-term projection remains speculative rather than a definitive forecast.
SOL ETF data compiled by Sosovalue indicates a net weekly redemption of $5.24 million, representing the second consecutive week of negative flows. Professional investor appetite remains subdued in the immediate term.
Get 3 Free Stock Ebooks
Discover top-performing stocks in AI, Crypto, and Technology with expert analysis.
- Top 10 AI Stocks - Leading AI companies
- Top 10 Crypto Stocks - Blockchain leaders
- Top 10 Tech Stocks - Tech giants


