
 Price Analysis: 28 Billion Tokens Accumulated at Critical Support Zone")
Key Highlights
- Approximately 28 billion DOGE changed hands at the $0.074 price point, establishing it as a critical support zone
- Technical analyst Kamran Asghar projects a potential move to $0.1150 contingent on support stability
- The memecoin is currently hovering around $0.0942, reflecting a 1.73% increase in the last 24-hour period
- The Relative Strength Index registers 48.78, indicating balanced market conditions without directional bias
- MACD indicator displays a minor bullish signal, though overall momentum lacks conviction
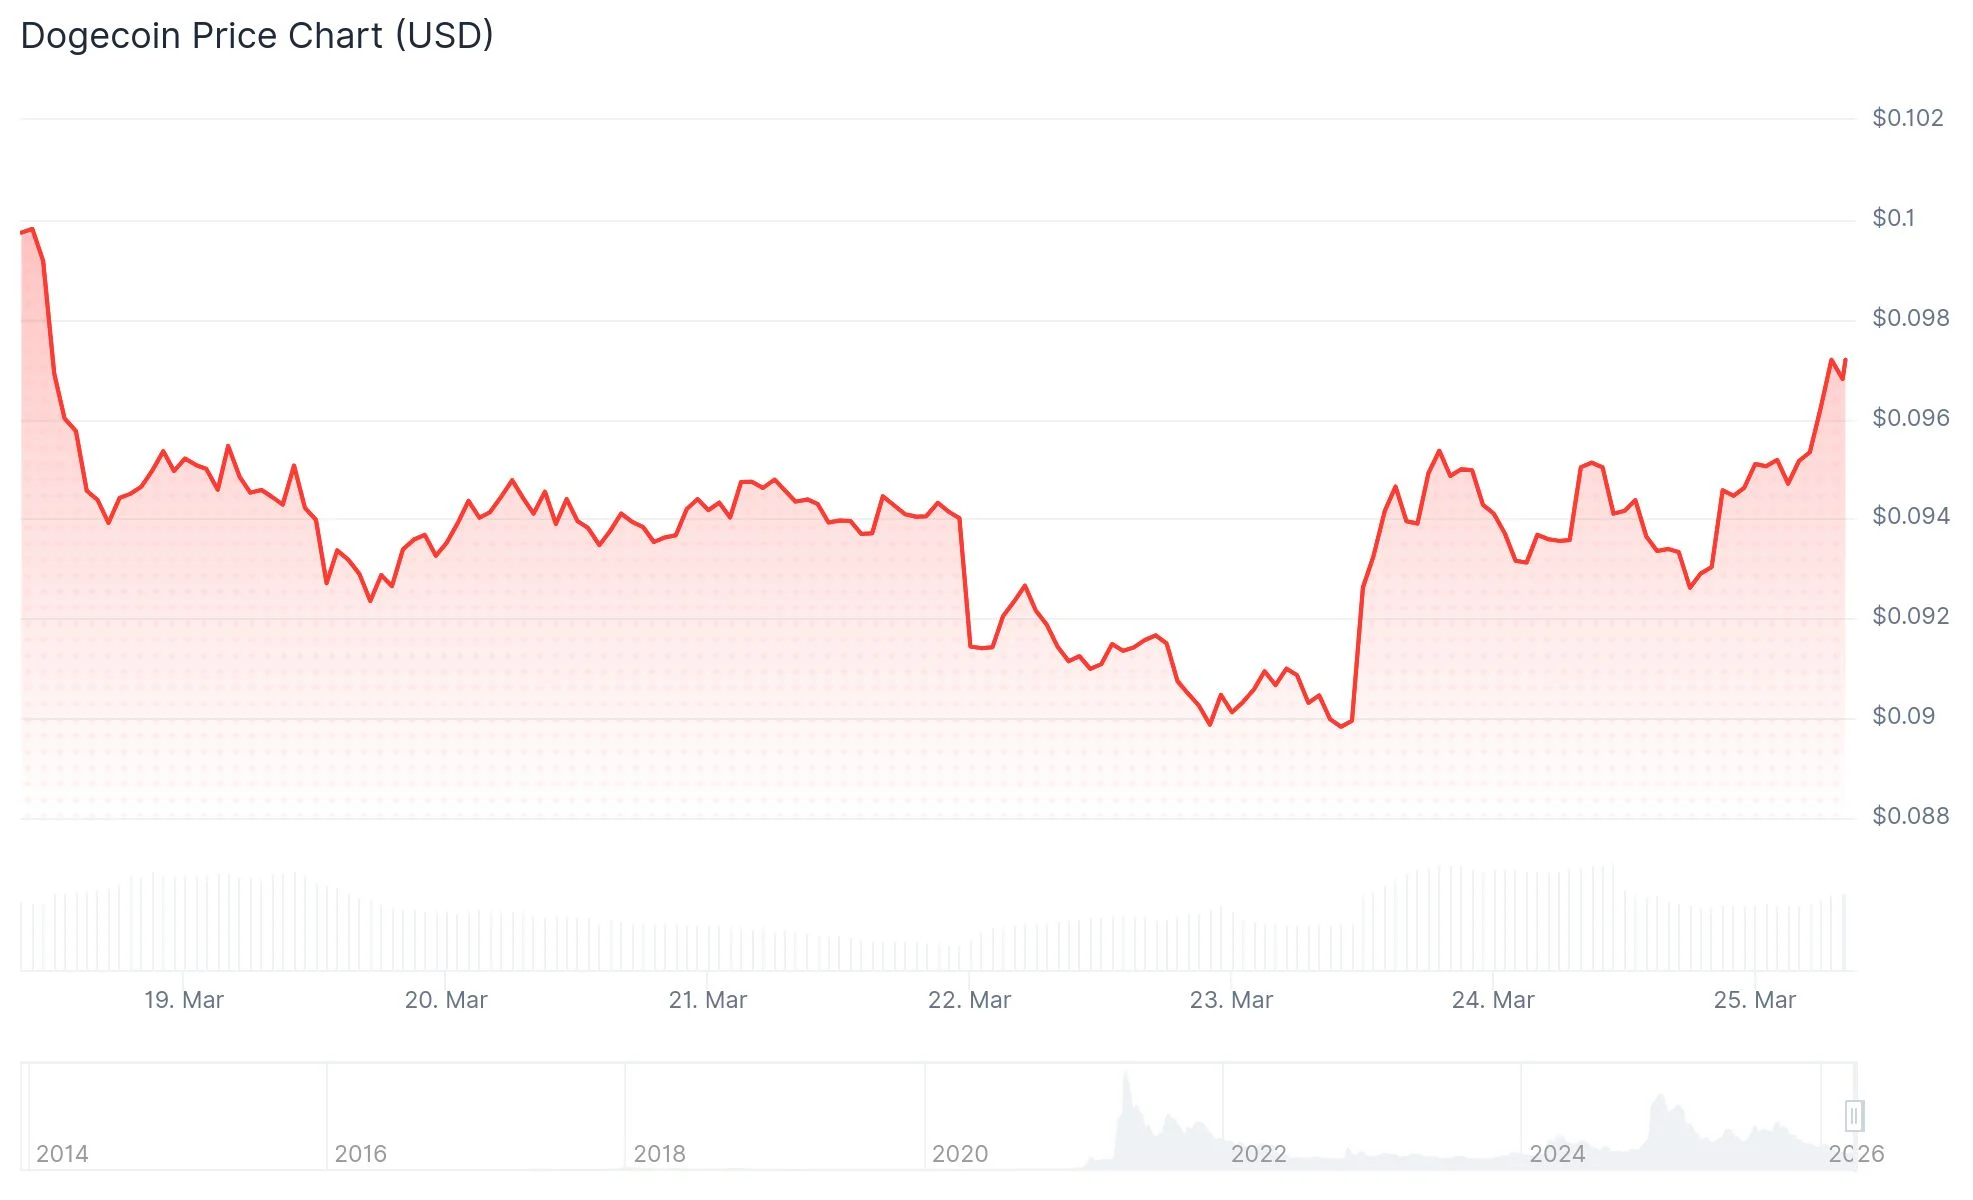
Dogecoin has established itself near the $0.0942 price point following a recovery from its intraday bottom at $0.0899. The modest 1.73% uptick in the past day reflects bulls attempting to challenge the $0.0955 resistance barrier.
The cryptocurrency experienced a pullback after encountering selling pressure at that threshold. Near-term support has stabilized around the $0.0930 mark. Successfully breaking through $0.0955 would potentially unlock additional upward momentum.
Market participants are closely monitoring the $0.074 level. Approximately 28 billion DOGE tokens were exchanged at this price point, which market observers interpret as evidence of substantial accumulation and concentrated buying pressure.
Technical analyst Ali Martinez highlights that the significant transaction volume at this level indicates strategic positioning by major stakeholders. Should the $0.074 foundation remain intact, the asset could challenge resistance at $0.088 before potentially advancing toward $0.096.
A breakdown beneath $0.074 would likely trigger additional downward pressure. Currently, market participants are actively defending this critical zone.

Expert Technical Perspectives
Cryptocurrency market analyst Kamran Asghar identifies DOGE as testing a support threshold that has historically catalyzed price recoveries. His technical forecast suggests a potential advance to $0.1150 assuming buyers emerge at current levels.
Asghar observes that this price zone has functioned as a springboard during previous market cycles. He emphasizes that transaction volume and market sentiment will be determining factors for the next directional move.
Analyst Ali Charts identifies DOGE as consolidating within a descending triangle formation. His analysis suggests a potential 29% price movement could materialize, though the ultimate direction remains unconfirmed.
Market commentator CW on X highlights the $0.085–$0.09 range as a historically significant bottom formation. His research shows that previous rebounds from this area have consistently produced substantial upside rallies.
The pattern of progressively higher lows within an ascending channel structure continues to hold. Maintaining price action above present support levels preserves the constructive technical outlook, according to CW’s assessment.
Technical Indicator Analysis
The Relative Strength Index currently stands at 48.78. This positioning places DOGE in neutral territory, reflecting equilibrium between buying and selling pressure.
Current price behavior remains distant from overbought or oversold thresholds. The market structure suggests a consolidation pattern following recent volatility.
The MACD configuration reveals a subtle bullish crossover, with the signal line marginally exceeding the baseline. The histogram displays minimal deviation from zero, confirming subdued momentum conditions.
While a tentative recovery attempt is underway, no pronounced divergence has emerged to validate an imminent breakout scenario.
As of March 25, 2026, DOGE was exchanging hands at $0.09419, having rebounded from the session’s lowest point of $0.0899.
Get 3 Free Stock Ebooks
Discover top-performing stocks in AI, Crypto, and Technology with expert analysis.
- Top 10 AI Stocks - Leading AI companies
- Top 10 Crypto Stocks - Blockchain leaders
- Top 10 Tech Stocks - Tech giants


