
 Price Maintains Key Support at $88 as Real-World Asset Ecosystem Surges Past $1.8B")
Key Takeaways
- SOL maintains position near $88, defending crucial trend line support following a retreat from $95 levels
- Market sentiment deteriorated with the Fear and Greed Index sliding to 30 (Fear) after Powell’s remarks on Iran conflict economic uncertainty
- Network activity remained robust with 880+ million transactions processed last week, though weekly fees stayed modest at $4.6 million
- Real-world asset tokenization on Solana has eclipsed $1.82 billion, while RWA DeFi total value locked reached $465 million
- Technical analysts identify the $50–$80 zone as a strategic accumulation area, projecting potential long-term targets from $500 to $1,000
Solana continues to defend the $88 price level following its recent decline from $95. The cryptocurrency remains anchored on a critical trend line support that market participants are monitoring with heightened attention.
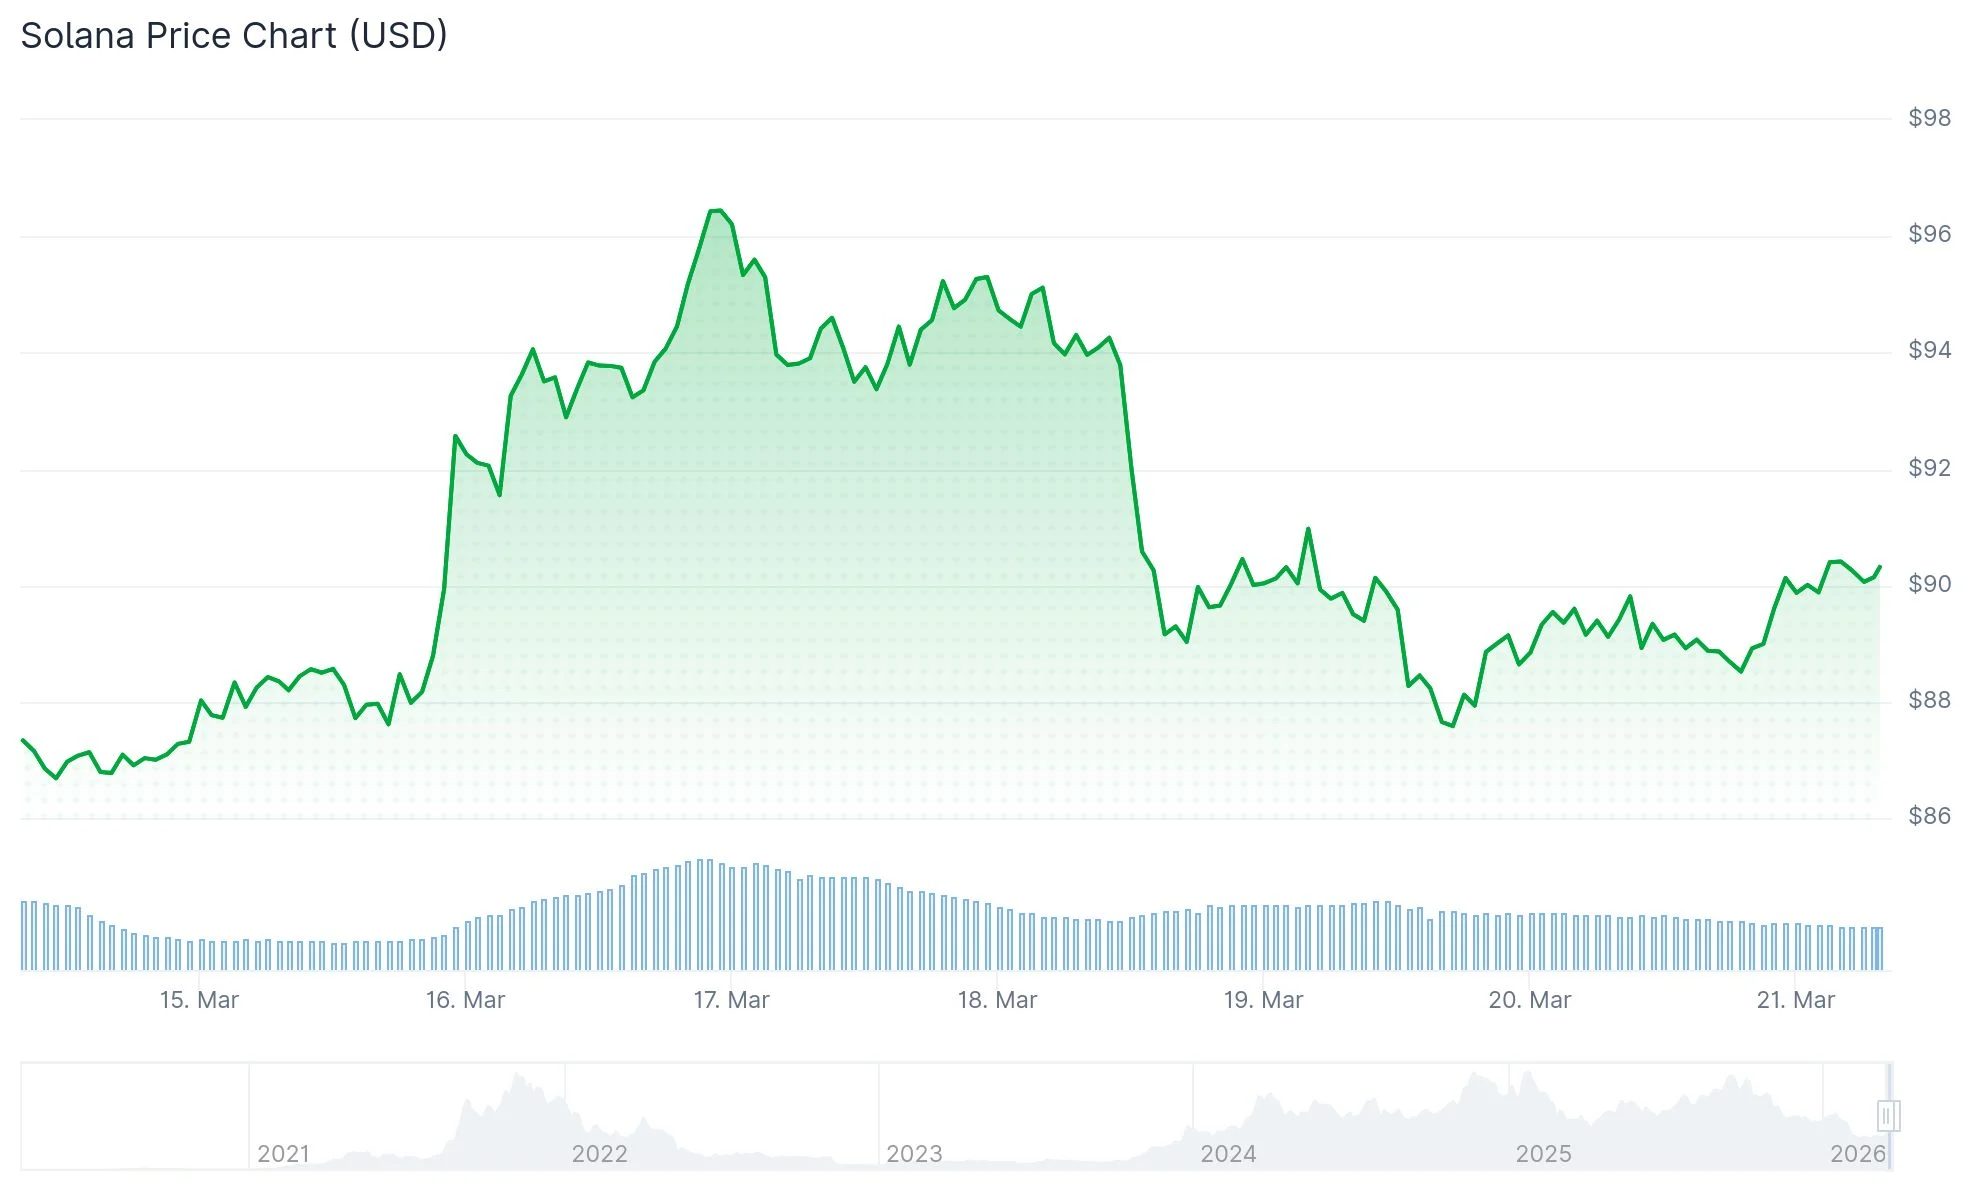
Daily trading volume has contracted to $3.3 billion, representing a significant decline from the $6.5 billion recorded on March 16 when SOL momentarily reached $95. Market data suggests bullish traders are liquidating positions earlier in price rallies as overall market confidence wavers.
The Crypto Fear and Greed Index experienced a sharp decline from 46 (Neutral) to 30 (Fear) following Federal Reserve Chair Jerome Powell’s comments regarding the “uncertain” economic consequences of the Iran conflict. Concerns about potential oil price surges and resulting inflationary pressures have raised questions about the Federal Reserve’s ability to implement planned rate cuts in 2025.
Transaction Volume Diverges from Fee Revenue
The Solana network maintained impressive throughput with more than 880 million transactions processed throughout the past week. This figure approaches the network’s all-time peak of 959 million transactions recorded during the week concluding February 8.
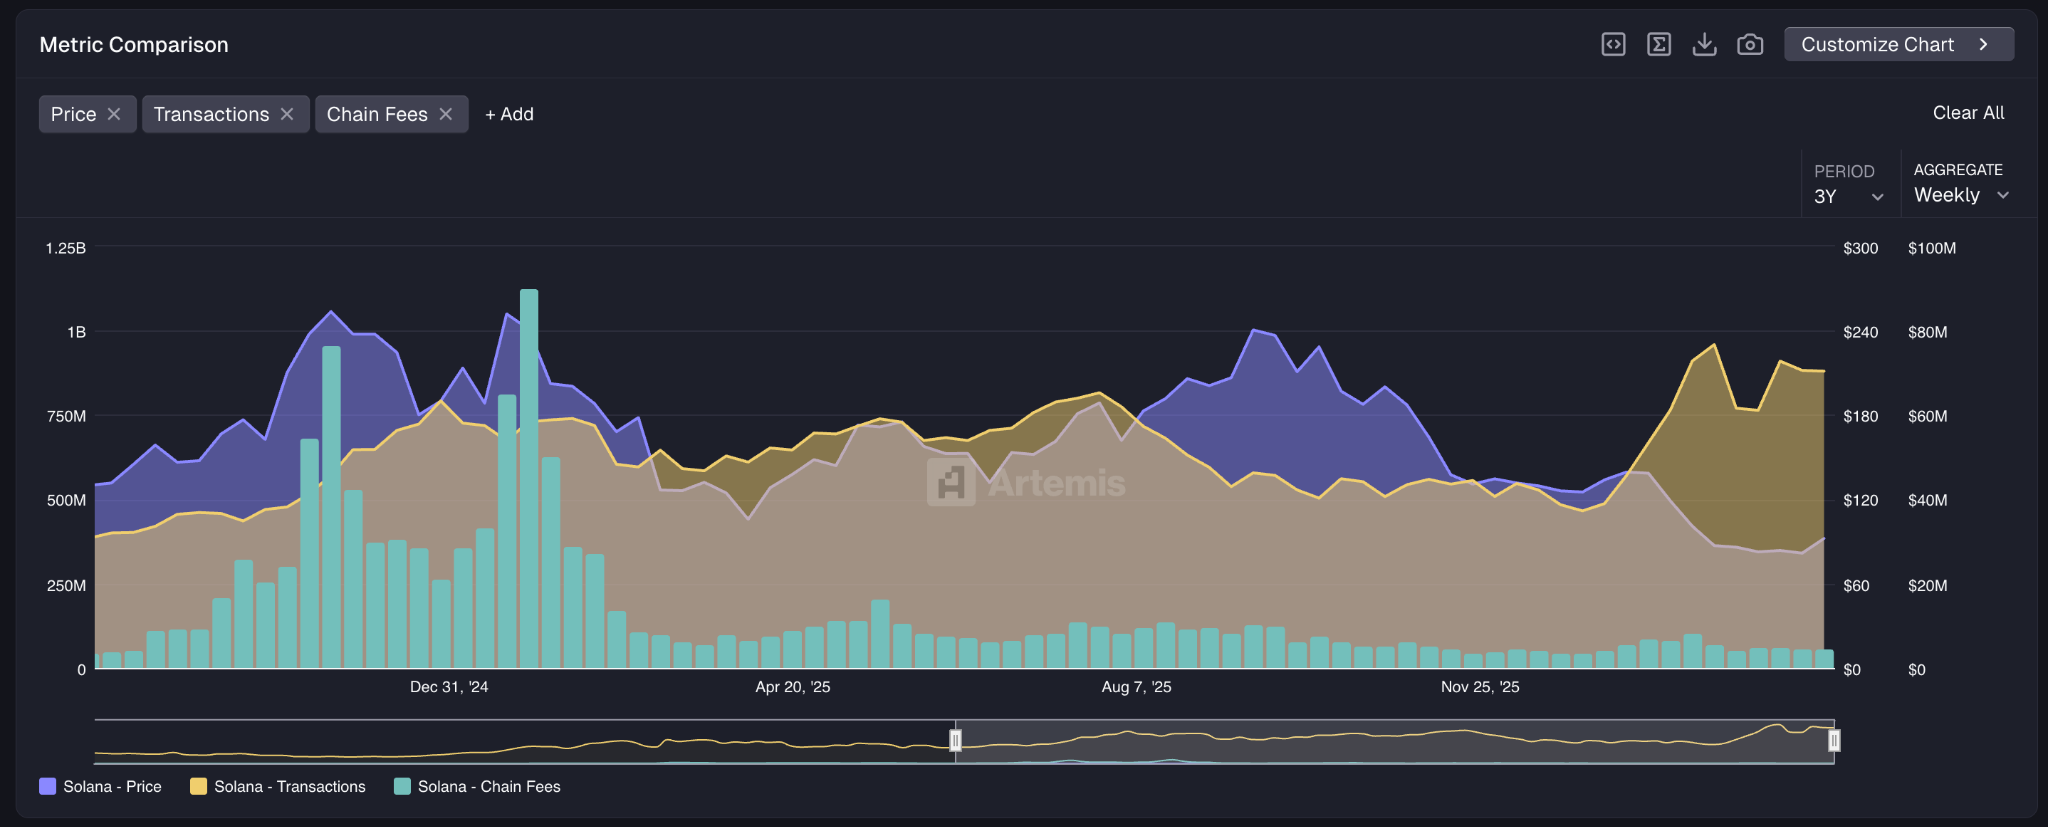
However, despite sustained high transaction counts, weekly network fees totaled only $4.6 million. This represents a 50% reduction compared to fees collected during Solana’s June–September 2025 price surge, when transaction volumes were comparatively lower at 700–800 million weekly.

The divergence between transaction activity and fee generation typically suggests lower network valuation. Market analysts interpret this growing disparity as a potentially bearish indicator for medium-term price action.
From a technical perspective, SOL confronts critical resistance at the $87 mark. A decisive break beneath this threshold could trigger a descent toward $77, representing an 11.5% downside move. Conversely, if support holds firm and substantial volume emerges during U.S. trading hours, the token could mount a recovery toward the $100 psychological level.
Real-World Asset Sector Achieves New Milestone
Solana’s real-world asset tokenization sector surpassed $1.82 billion in total value on March 20. This figure encompasses tokenized debt instruments, equity securities, and investment funds migrated onto the blockchain infrastructure.
DeFi protocols backed by real-world assets on Solana achieved an unprecedented $465 million in total value locked. Although Ethereum maintains dominance in the overall RWA marketplace, Solana continues expanding its footprint in this emerging sector.
Cryptocurrency analyst Crypto Patel shared technical analysis on X, noting that the monthly timeframe displays a confirmed breakout pattern, successful retest, and firmly defended support zones. Patel emphasized that Fibonacci retracement levels remain intact and characterized the $50–$80 range as an exceptional accumulation opportunity. Drawing from historical cycle patterns, Patel projected that SOL could potentially reach $500–$1,000 if previous market cycles serve as precedent.
SOL currently hovers around $88, with the $87 support threshold serving as the critical benchmark for near-term directional bias.
Get 3 Free Stock Ebooks
Discover top-performing stocks in AI, Crypto, and Technology with expert analysis.
- Top 10 AI Stocks - Leading AI companies
- Top 10 Crypto Stocks - Blockchain leaders
- Top 10 Tech Stocks - Tech giants


